Open topic with navigation
Refunds & Credit Notes Related Reports
The below Refunds & Credit Notes Related Reports are available (the location where each Report can be found has been listed below next to the report name):
Return to top
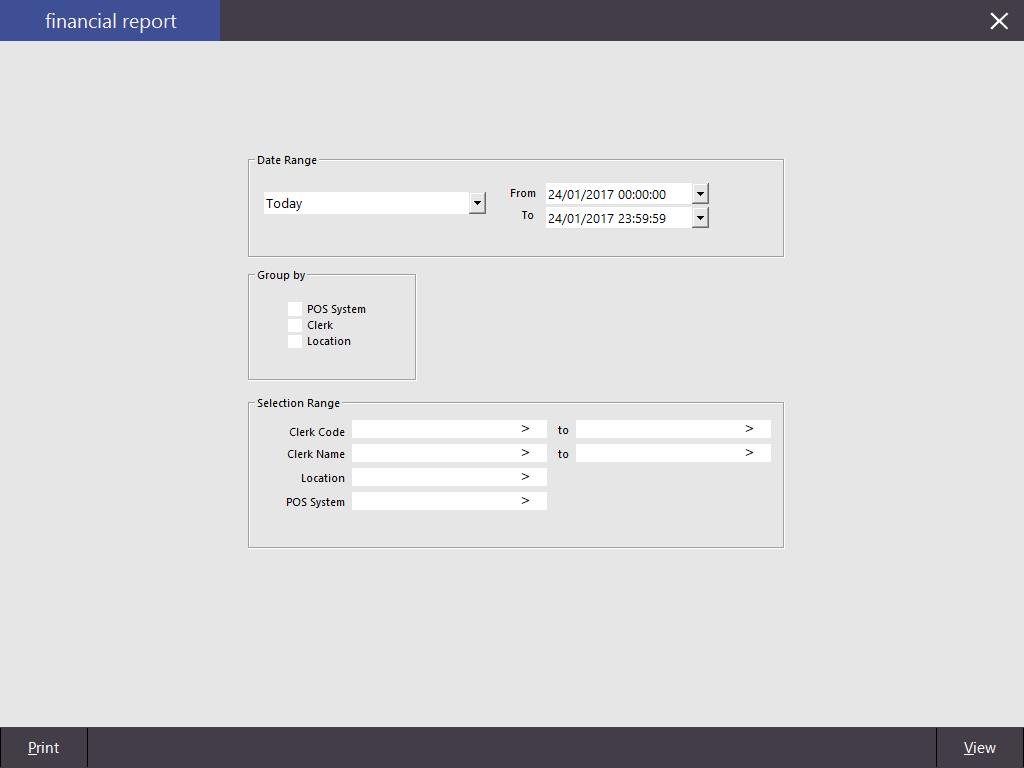
Financial Report
This report will allow you to use the following options:
- Date Range
- Group By – POS System, Clerk, Location, Site (Only available with HO & SM Modules)
- Selection Range – Clerk Code, Clerk Name, Location, POS System, Site (Only available with HO & SM Modules)
This report will display all financial information of the specific functions used for the duration of the selected date range, and will detail the totals for each function that has been recorded through the POS Screen. This report will not display any amounts that have been entered as a Cash Declaration.
Total Sales (Inc Tax) amount will only display on terminals using the Canada/USA Regional setting.
Return to top
Financial Trend
This report will allow you to use the following options:
- Date Range
- Group By – POS System, Location, Graph
- Options – List, Comparison, Group (Hourly, Weekday, Daily, Weekly, Monthly, Quarterly, Yearly), Filter
- Selection Range – Clerk Code, Location, POS System, Site (Only available with HO & SM Modules)
This report will allow you to see the “trend” of the selected range for the financial functions over a spread of data selections. You are able to see at a glance figures that stand out as incorrect or need attending.
Return to top
Credit Notes
This report will give you the following options:
- Credit Notes Issued – Date Range
- Credit Notes Expiring – Date Range
- Report Options – All Unredeemed, Totally Redeemed, Partially Redeemed, Expired Unredeemed
This report will show the Credit Note details dependent on the options selected.
Return to top
Stock Item Sales
This report will detail the quantities of each selected Stock Item within the range. This report will give you the following options:
- Date Range
- Sort Order – Code, Description, Best/Worst (Quantity, Sales Amount, Cost of Sales, Profit Amount, Discounts)
- Options – Show Stock Items, Group by Sell Price, Consolidate Site Items (Only available with HO & SM Modules), Unit Price is Price 1, Hide Unit Price/Tax, Portrait.
- Optional Grouping – 14 field selections (Site, Supplier, Location, POS Terminal, Sales Category, Price Level, Department, Tax, Refund Reason, Clerk, Customer, Customer Type, Sale Type, Audit, Attributes), Show Group Label, Totals Only, Totals with Group Label.
- Selection Range – Price Level, Code, Description, Supplier, Department, Location, POS System, Clerk, Sale Type (appears when the Sale Type option has been selected under Optional Grouping), Site (Only available with HO & SM Modules), Attributes, Tags (to add tags to the selection range, enter a comma after entering the tag to add the tag; the tag will appear to the right-hand side of the tags field, tags can be removed by pressing the "X" button to the right-hand side of the tag text).
This report will show the breakdown of sales by Stock Item.
The Unit Price Inc column is always inclusive, including regions which sell items with Ex Tax Rates (i.e. Tax is applied or added to the item during the finalisation of the sale).
This report is useful for viewing the total quantities of a particular item or items within a specific department when trying to achieve sales goals.
Open topic with navigation
