Open topic with navigation
Sales
The Sales group has twenty one main reports that are available which are:
Tip!
The End of Day Time, First Day of Week, Start of Financial Year and Sessions/Session Times can all be customised in Idealpos which will affect the date range (From/To) that's used when using any of the pre-defined periods in the Date Range option.
The locations in Idealpos where these settings can be customised are summarised below:
End of Day time - Back Office > Setup > Global Options > General > End of Day.
First Day of Week - Back Office > Setup > Global Options > General > First Day of Week.
Start of Financial Year - Back Office > Setup > Global Options > Miscellaneous > Start of Financial Year
Sessions - Back Office > Setup > Global Options > Restaurant > Sessions - Only session names and times that have been configured will appear as an available period in the reports that support the selection of a session.
Return to top
Stock Item Sales
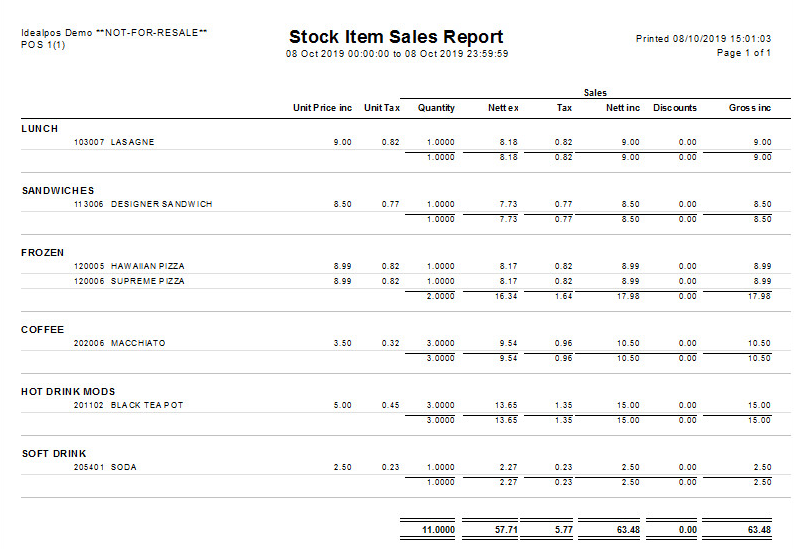
This report will detail the quantities of each selected Stock Item within the range.
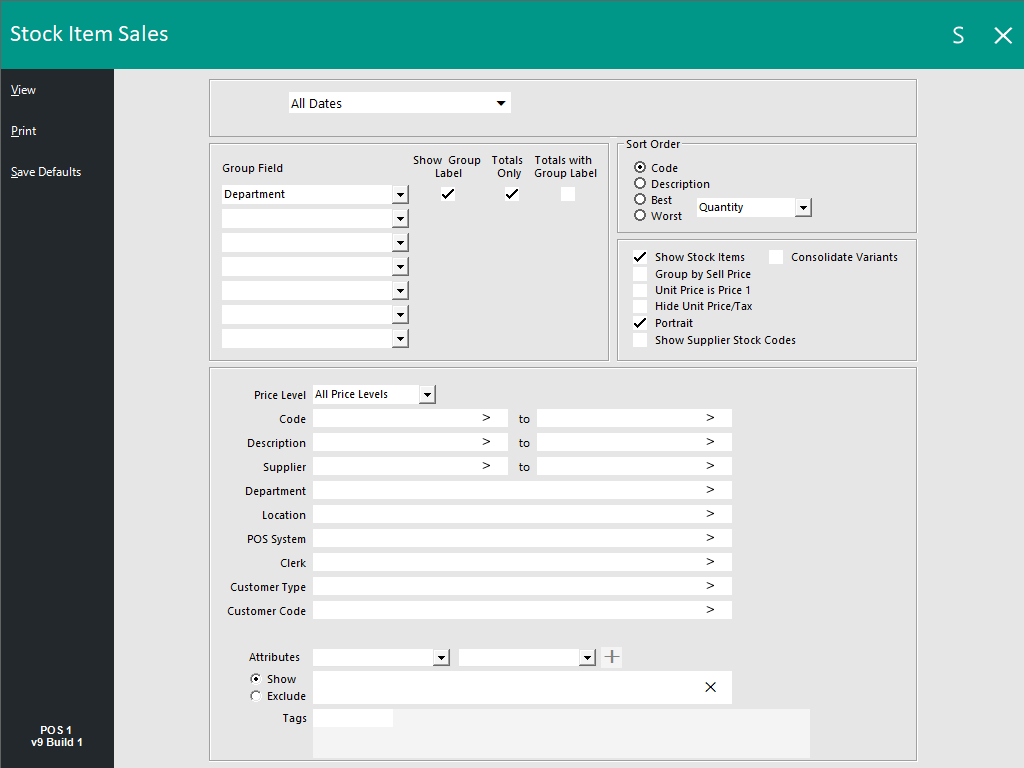
This report will give you the following options:
- Date Range
- Sort Order – Code, Description, Best/Worst (Quantity, Sales Amount, Cost of Sales, Profit Amount, Discounts).
-
- Top N records - This field will appear when selecting the Best or Worst option, and will default to 100. When entering a top N number of records using this option, the report will be limited to displaying the number of records that match the number entered. Note too if using the Grouping option (e.g. to Group by Department), the report will display the top N records for each Department (e.g. If 2 is entered, then the Top 2 records for Coffee, Top 2 records for Entree, etc. will be listed for each Department). If the Grouping option is not used, then the report will be limited to only displaying the entered number of Top N records overall (e.g. If 2 is entered, then the report will only contain 2 records in total which will be the Best or Worst records, as per the Best or Worst option that is selected when running the report).
- Options – Show Stock Items, Group by Sell Price, Consolidate Site Items (Only available with HO & SM Modules), Unit Price is Price 1, Hide Unit Price/Tax, Portrait, Show Supplier Stock Codes (enabling this option will display the Supplier Stock Codes instead of the Stock Codes), Consolidate Variants, Include Non-Attributed (this option only appears when selecting an Attribute is included in one of the Group Fields).
- Optional Grouping – 14 field selections (Site, Supplier, Location, POS Terminal, Sales Category, Price Level, Department, Tax, Refund Reason, Clerk, Customer, Customer Type, Sale Type, Audit, Attributes), Show Group Label, Totals Only, Totals with Group Label.
- Selection Range – Price Level, Code, Description, Supplier, Department, Location, POS System, Clerk, Customer Type, Customer Code, Sale Type (appears when the Sale Type option has been selected under Optional Grouping), Site (Only available with HO & SM Modules), Attributes, Show/Exclude (this is the list in which any Attributes that have been selected will appear in), Tags (to add tags to the selection range, enter a comma after entering the tag to add the tag; the tag will appear to the right-hand side of the tags field, tags can be removed by pressing the "X" button to the right-hand side of the tag text).
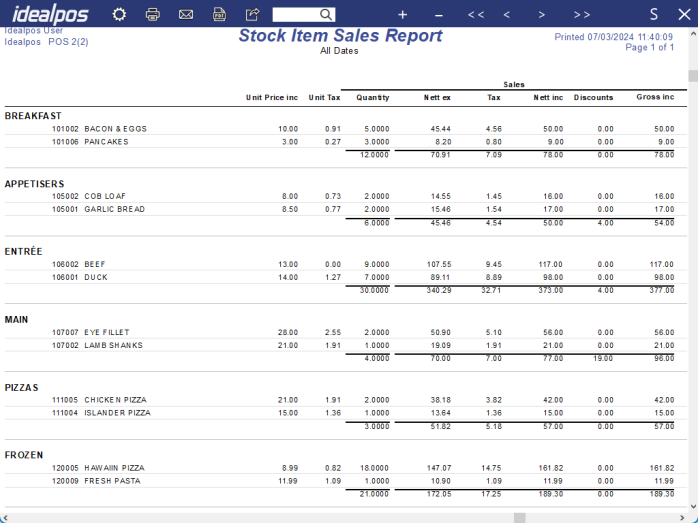
The Stock Item Sales Report is the first report in Idealpos to have MDI (Multiple Document Interface) functionality enabled.
This functionality enables report window to be resized using the resize button (top-right corner of the report window), which in turn enables additional reports to be run concurrently as well as the ability to access other Back Office functions at the same time that the report is being displayed.
Tip!
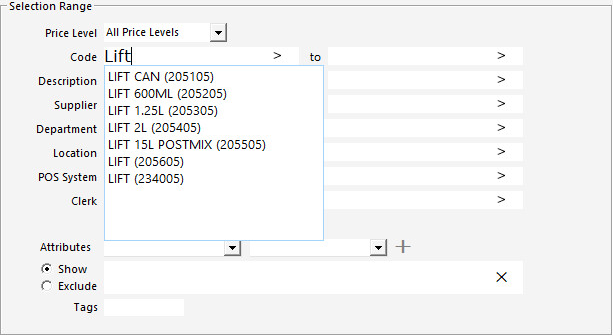
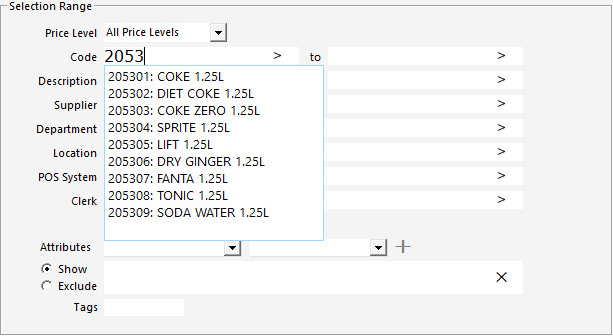
The Selection Range in Stock Item Sales includes support for Fast Lookup Textboxes.
Fast Lookup Textboxes enable a fast lookup to be performed in any of the fields shown in the Selection Range by simply entering either a numeric or text value.
As the value is entered, any records that match the value that has been entered so far will be displayed in a list and you may select the required option by either clicking on it or using your keyboard's arrow keys, then selecting the entry by pressing Tab or Enter.
This function allows records to be looked up either by their numerical value or description value, regardless of whether the field requires a Code or Description.
Once you select the required entry from the list, either the description or code will be entered into the field, depending on the field type.
E.g. When performing a lookup in a Code field, a Stock Item code can be entered into the Code field to display a list of items that contain or match the entered code.
A Stock Item Description can also be entered into the Code field and any items which match the entered description will be displayed.
Once an item is selected, its Code will be entered into the Code field, regardless of whether it was searched using the Description or Code.
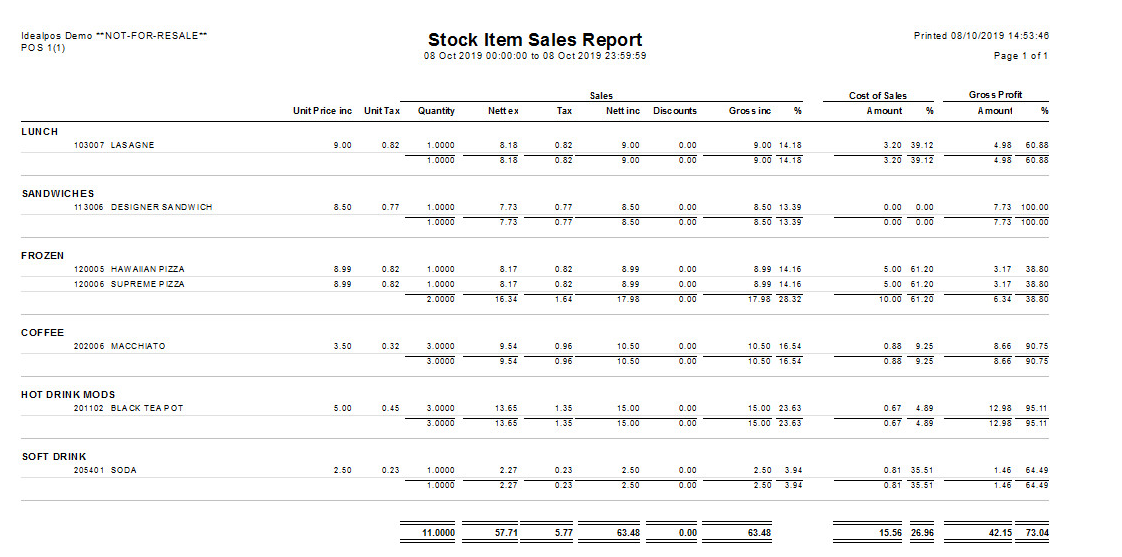
This report will show the breakdown of sales by Stock Item.
The Unit Price Inc column is always inclusive, including regions which sell items with Ex Tax Rates (i.e. Tax is applied or added to the item during the finalisation of the sale).
This report is useful for viewing the total quantities of a particular item or items within a specific department when trying to achieve sales goals.
MDI Functionality (Multiple Document Interface)
The Stock Item Sales Report supports MDI functionality.
When running a report, the top-right corner of the report window will display a resize button (on higher screen resolutions such as 1920x1080 that support this functionality).
The button will be hidden on lower screen resolutions that don't support this functionality (such as 1024x768).
The resize button can be pressed to resize the report from full screen to a window.
This enables multiple reports to be run concurrently and displayed side-by-side.
Other Idealpos Back Office functions and menus can also be accessed when the report is being displayed as a resized window.
Use Stock Item Last Cost User-Defined
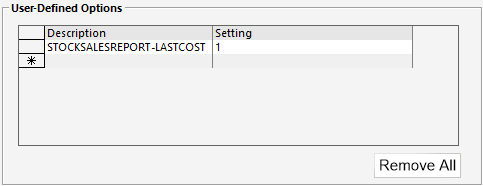
The Stock Item Sales Report can be set to use the Last Cost instead of the Standard Cost via a User-Defined Option.
To enable this functionality, go to:
Back Office > Setup > POS Terminals > Select a POS Terminal > Modify > POS Settings tab.
Create the following User-Defined Option:
Description: STOCKSALESREPORT-LASTCOST
Setting: 1
Close the POS Terminals window to save the change.
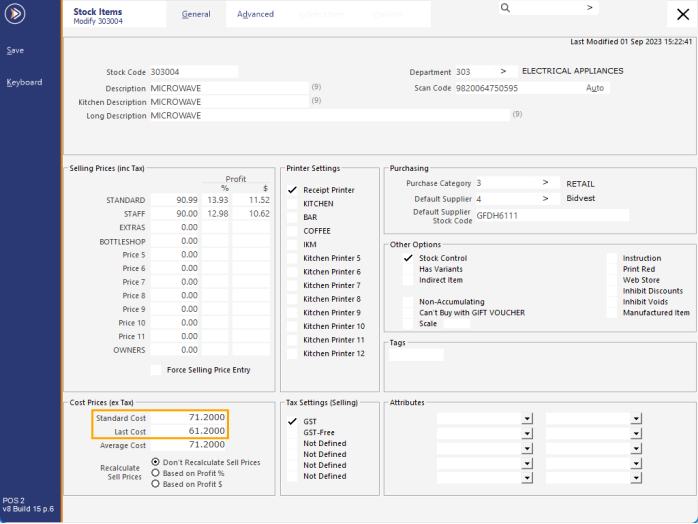
To demonstrate this function, the Idealpos Demo Database contains a "MICROWAVE" Stock Item with a Stock Item Code 303004.
The Stock Item's Standard Cost has been set to 71.2000 and the Last Cost has been set to 61.2000.
Select the "Cost of Sales" option within the Sort Order section when running the Stock Item Sales Report.
When the Stock Item has been sold and the User-Defined Option "STOCKSALESREPORT-LASTCOST" is set as 1, the Last Cost of 61.2000 will be displayed on the report.
When the Stock Item has been sold and the User-Defined Option "STOCKSALESREPORT-LASTCOST" is set as 0 (or if the User-Defined Option hasn't been created), the Standard Cost of 71.2000 will be displayed on the report.
Top N Records
The Top N Records function is available when using the Best/Worst options.
The Top N Records function will limit the number of records shown to the number entered in the Top N field.
When used with Grouping, the Top N Records function will show the Top N records for each group (e.g. each Department).
When used without Grouping, the Top N Records function will show the overall Top N records.
A few examples are shown below to distinguish the difference between using this function with Grouping and without Grouping.
E.g. With Department Grouping, selecting Best > Quantity > 2.
This will display two of the best Quantity records for items in each Department.
When Grouping is not used, the report will only show the overall top N of records for the Best/Worst.
E.g. Without Department Grouping, selecting Best > Quantity > 2.
This will only display two of the overall best Quantity records.
Return to top
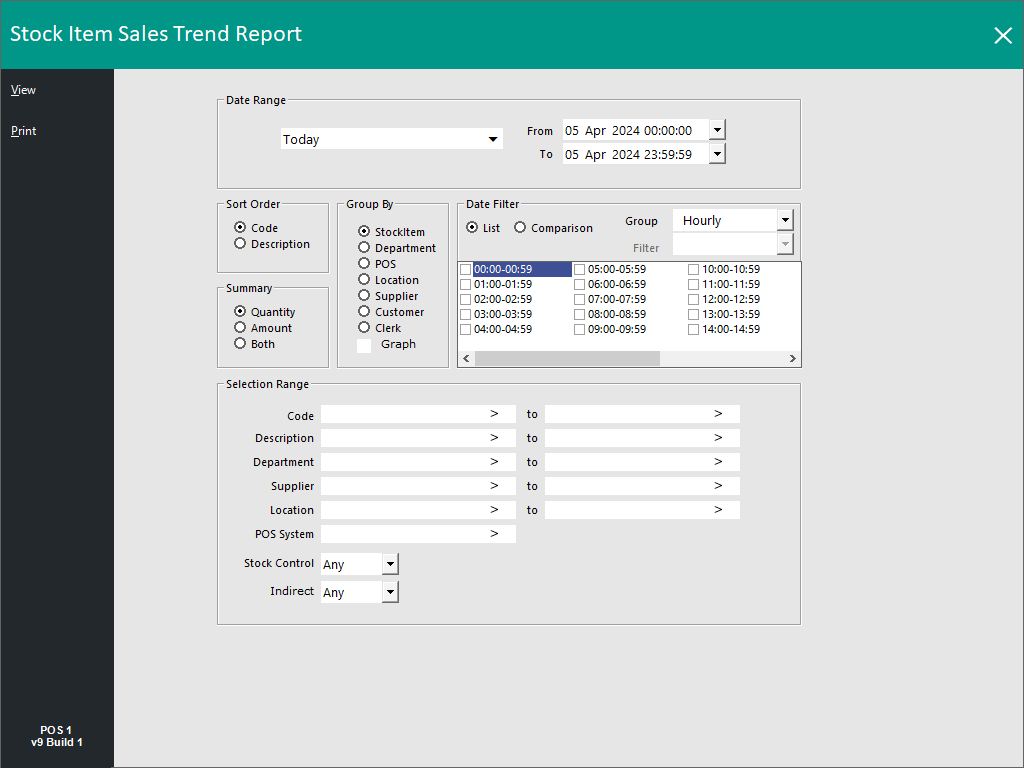
Stock Item Sales Trend
This report will give you the following options:
- Date Range
- Sort Order – Code, Description
- Summary – Quantity, Amount, Both
- Group By – Stock Item, Department, POS, Location, Supplier, Customer, Clerk, Graph
- Date Filter – List, Comparison, Group (Hourly, Weekday, Daily, Weekly, Monthly, Quarterly, Yearly)
- Selection Range – Code, Description, Department, Supplier, Location, POS System, Stock Control (Any, Yes, No), Indirect (Any, Yes, No)
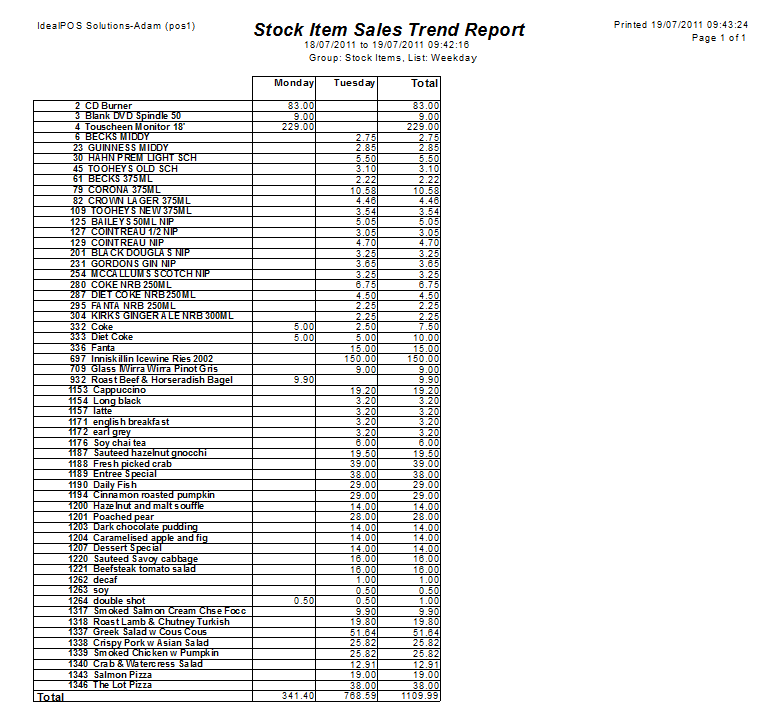
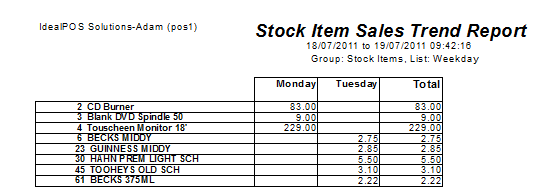
This report will display the Stock Item sales breakdown over a selected range.
Return to top
Department Sales
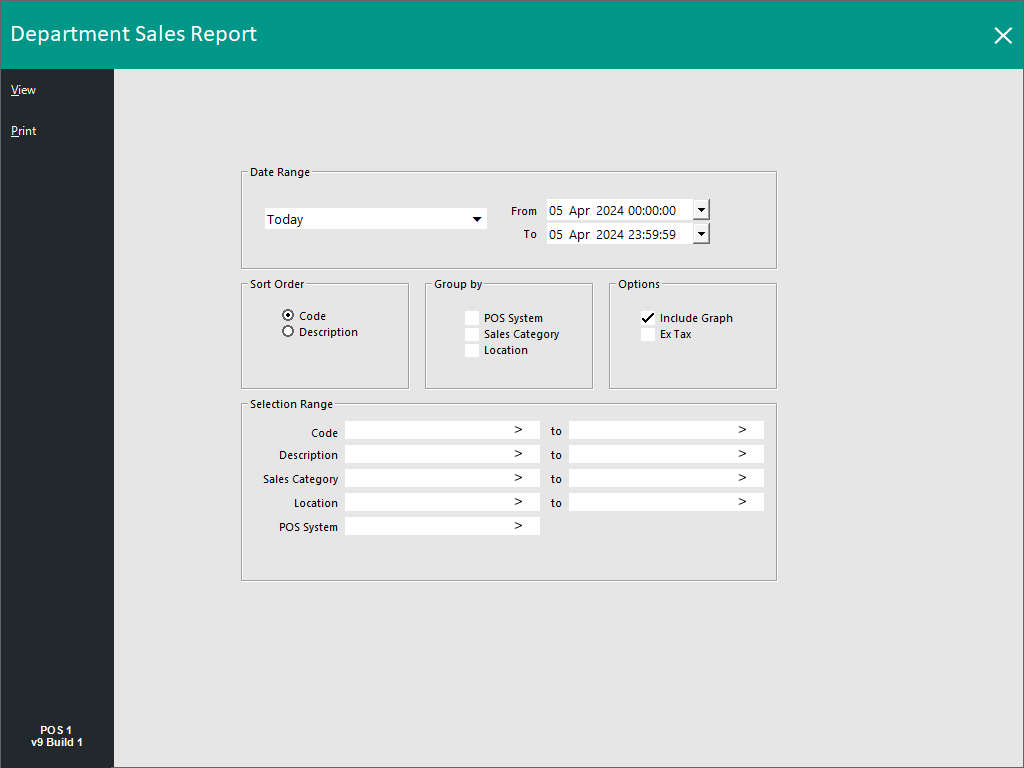
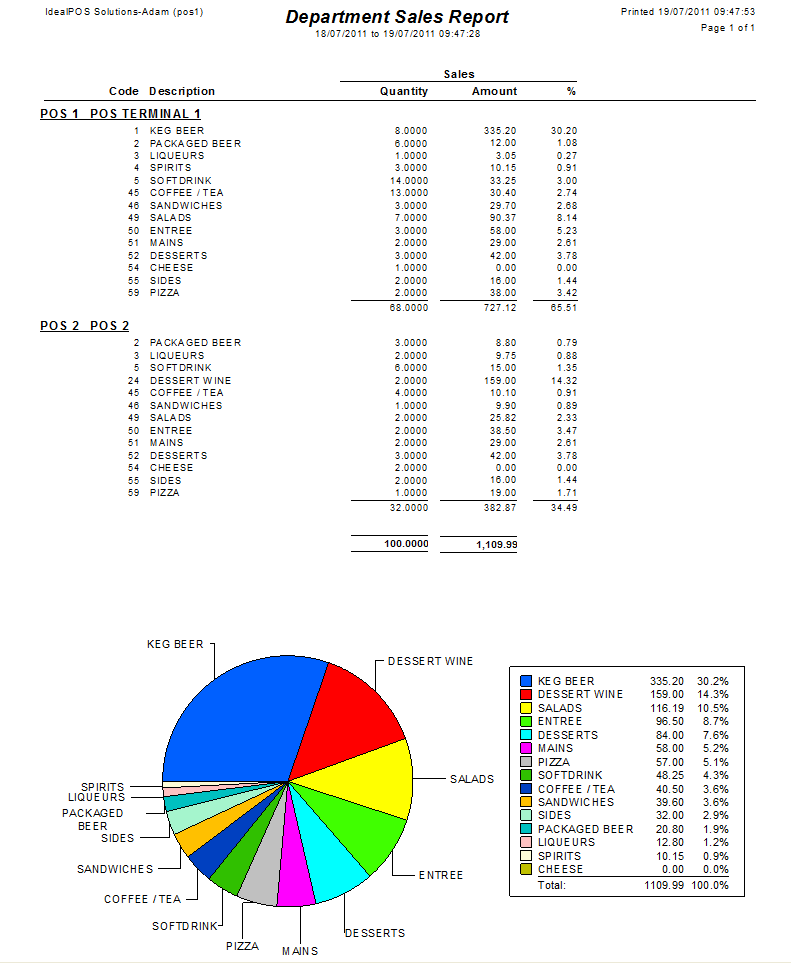
This report will give you the following options:
- Date Range
- Sort Order – Code, Description
- Group By – POS System, Sales Category, Location
- Options – Include Graph, Ex Tax
- Selection Range – Code, Description, Sales Category, Location, POS System
This report will provide a breakdown of each Department sales.
This report can be printed to the receipt printer by using the relevant function in the POS Screen programming.
Return to top
Department Sales Trend
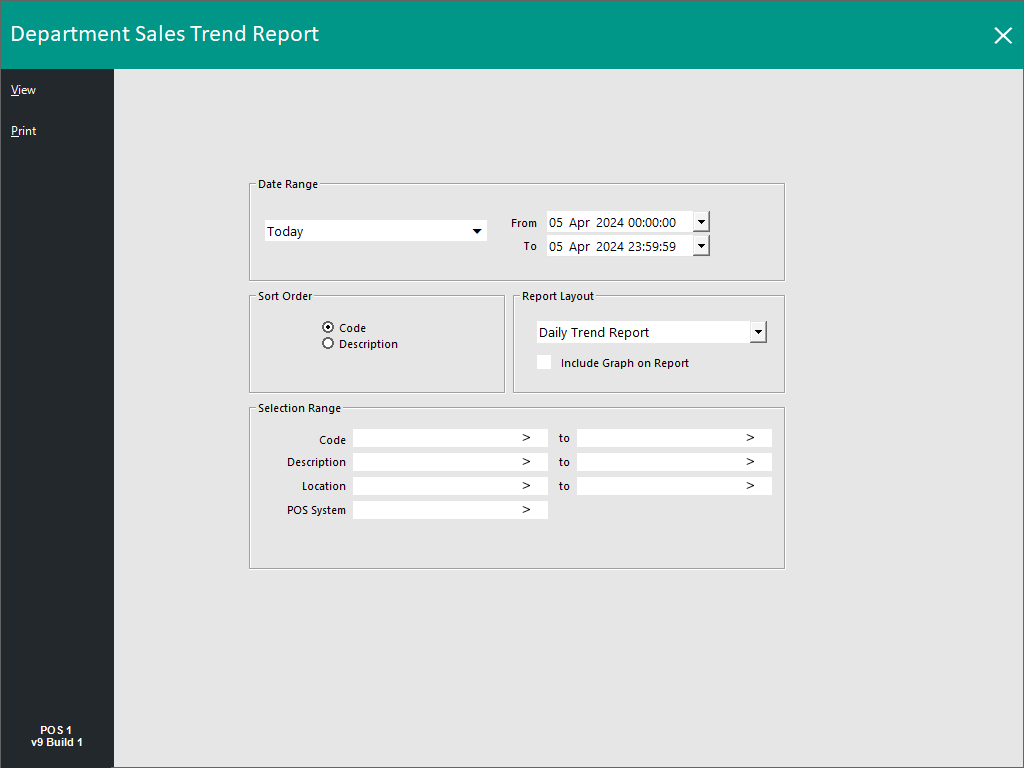
This report will give you the following options:
- Date Range
- Sort Order – Code, Description
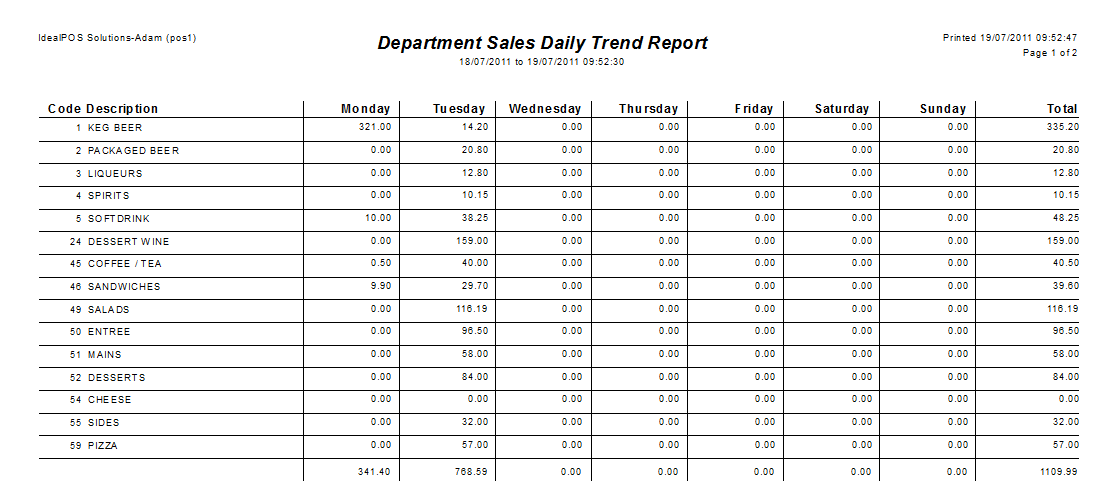
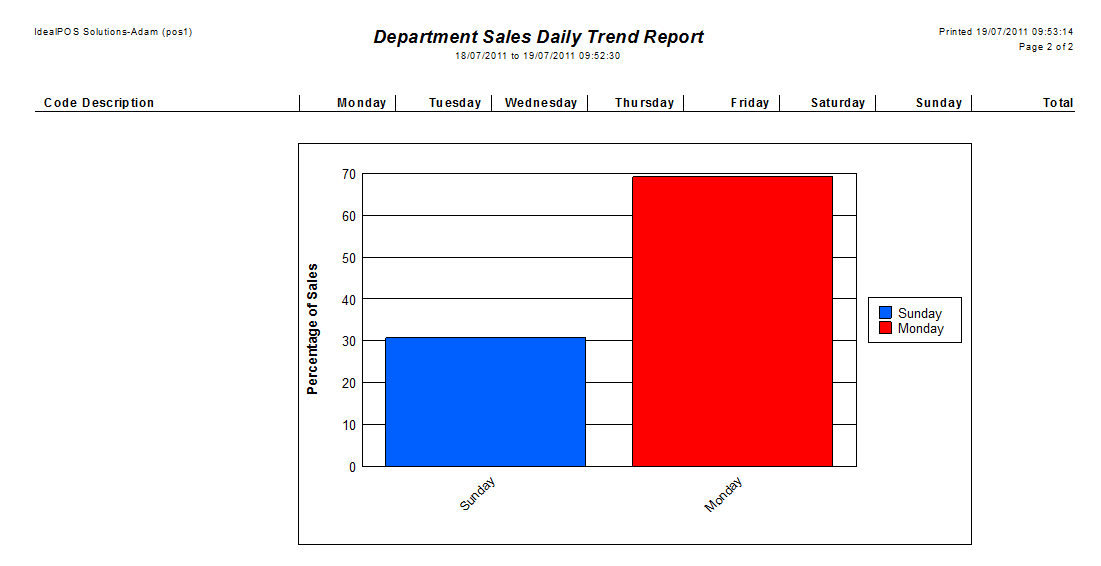
- Report Layout – Daily Trend Report, Monthly Trend Report, Include Graph on Report
- Selection Range – Code, Description, Location, POS System
This report will display the Department sales breakdown over a selected range.
Return to top
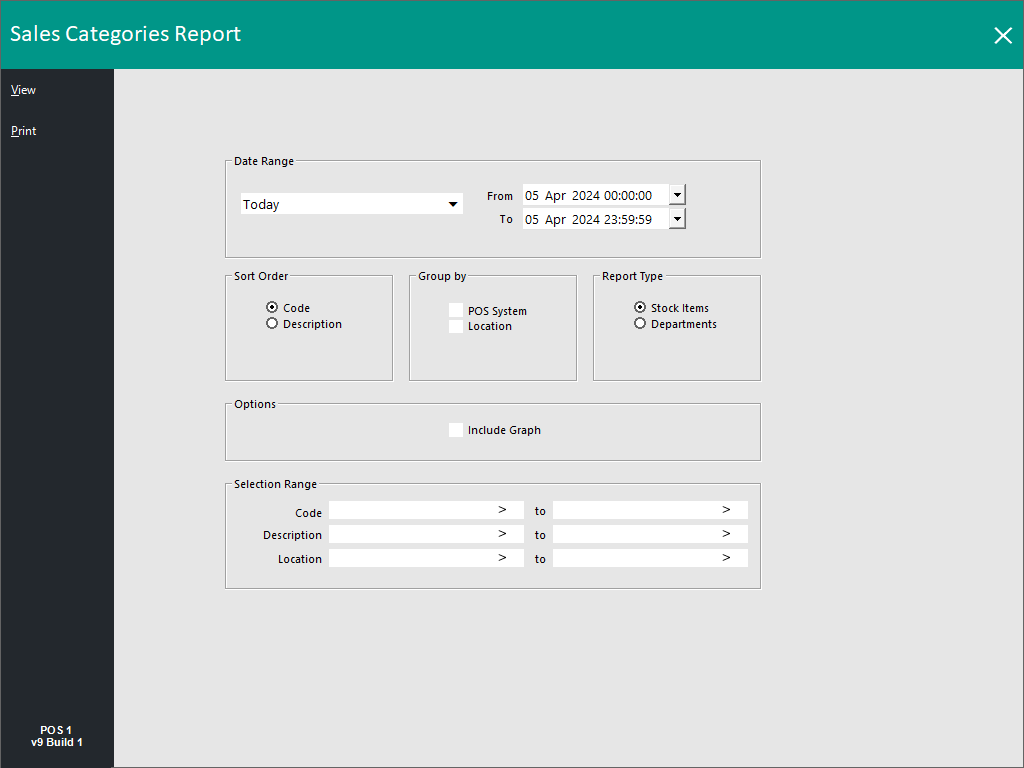
Sales Categories
This report will give you the following options:
- Date Range
- Sort Order – Code, Description
- Group By – POS System, Location
- Report Type – Stock Items, Departments
- Options – Include Graph
- Selection Range – Code, Description, Location
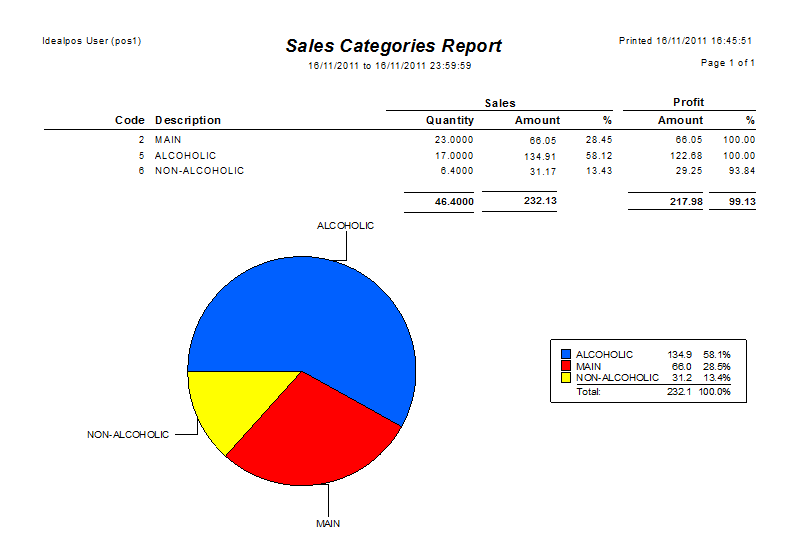
This report will display the totals for Sales Categories over a defined period.
Sales Categories group Departments.
Return to top
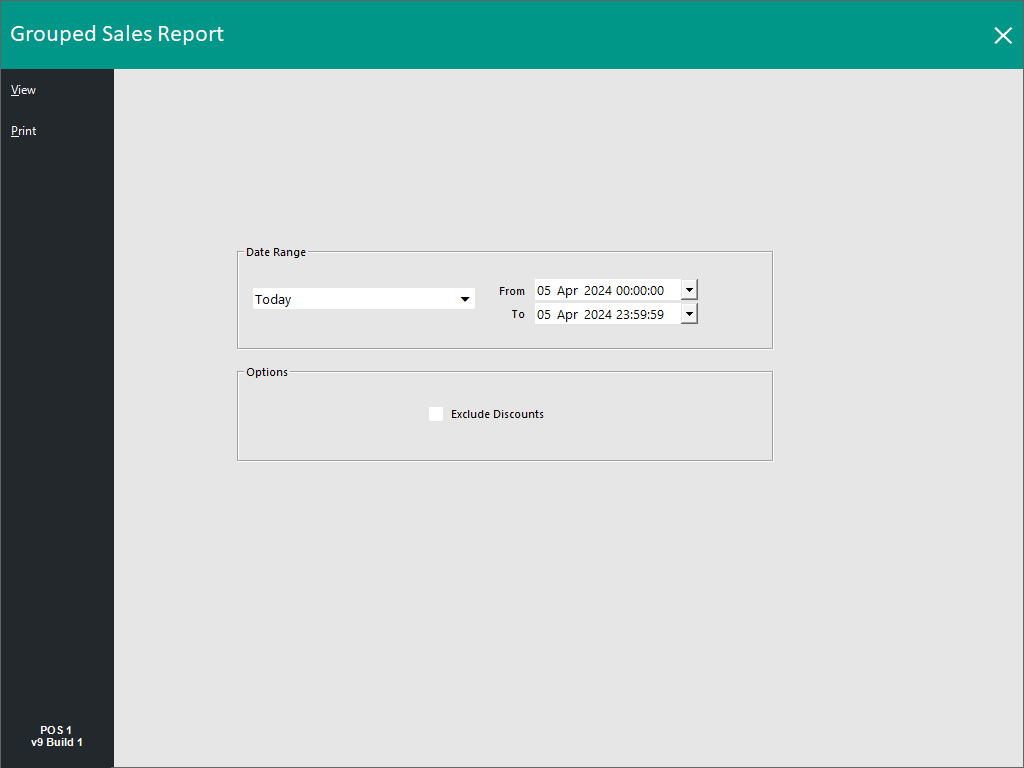
Grouped Sales
This report will give you the following options:
- Date Range
- Exclude Discounts
The grouped sales report generates one report with the ability to cascade through the report.
The first level is sales categories, by double clicking on this you are taken to the department totals.
Double click on a department and the stock items that make up this department are displayed.
By double clicking on the stock item the report displays the time and date of the sales, the clerk that sold them, quantity sold and the sale price.
Return to top
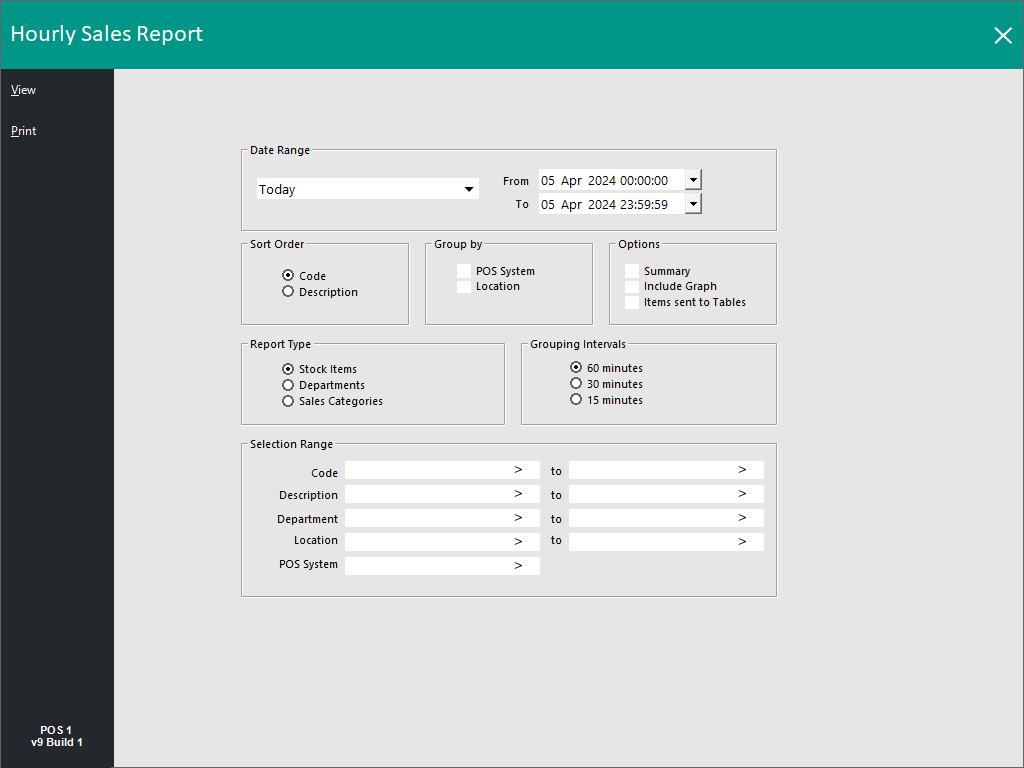
Hourly Sales
This report will give you the following options:
- Date Range
- Sort Order – Code, Description
- Group By – POS System, Location
- Options – Summary, Include Graph, Items sent to Tables
- Report Type – Stock Items, Departments, Sales Categories
- Grouping Intervals – 60 minutes, 30 minutes, 15 minutes
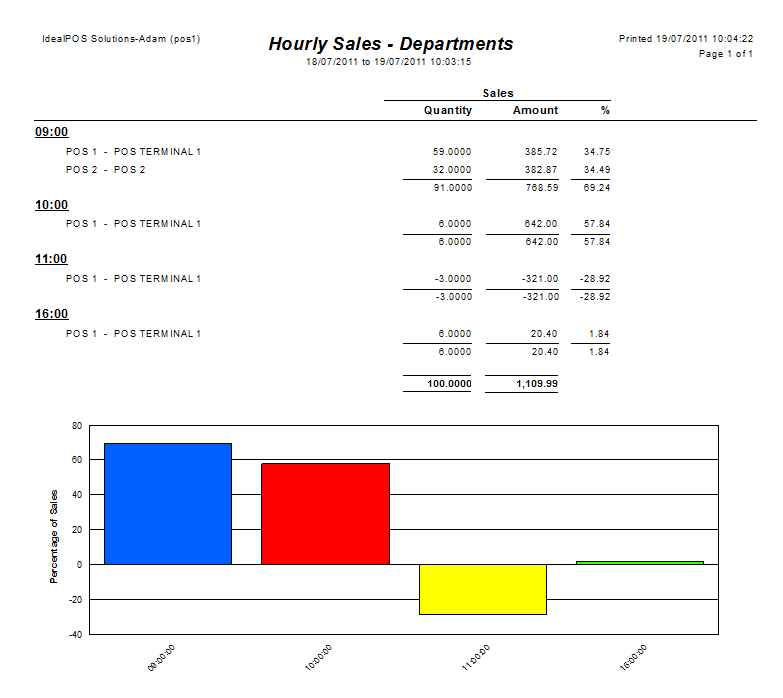
This report will display the selected sales by the Hour.
Return to top
Clerk Sales
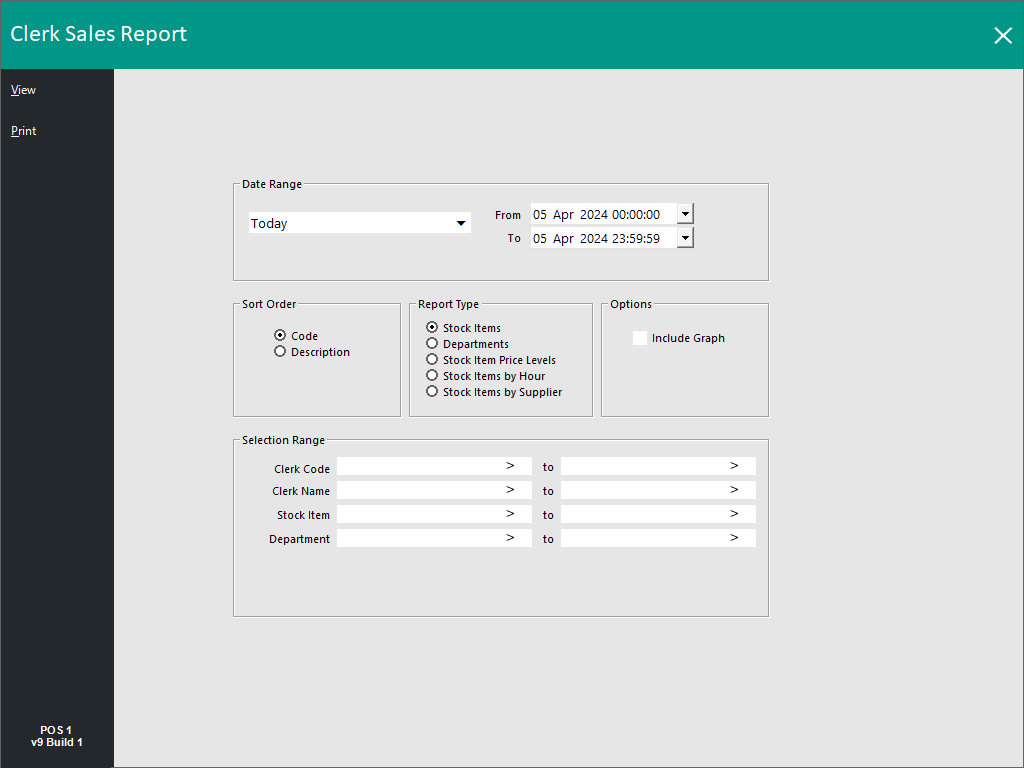
This report will give you the following options:
- Date Range
- Sort Order – Code, Description
- Report Type – Stock Items, Departments, Stock Item Price Levels, Stock Items by Hour, Stock Items by Supplier
- Options – Include Graph
- Selection Range – Clerk Code, Clerk Name, Stock Item, Department, Site (using HO/SM only)
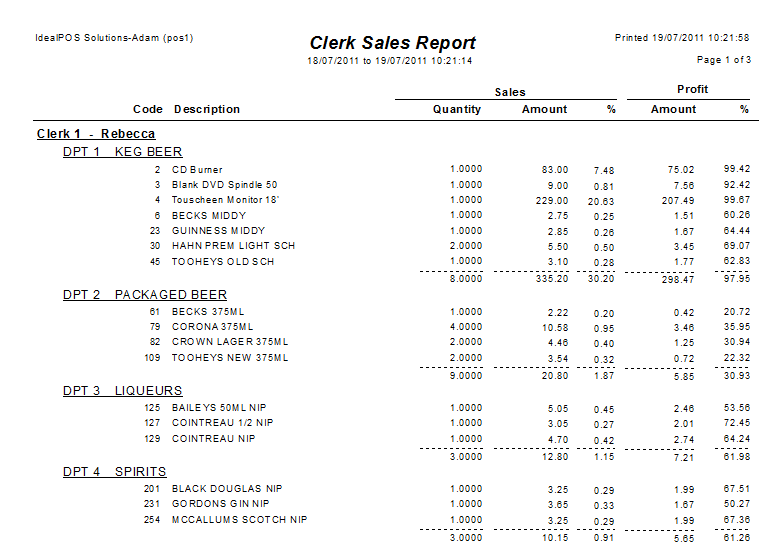
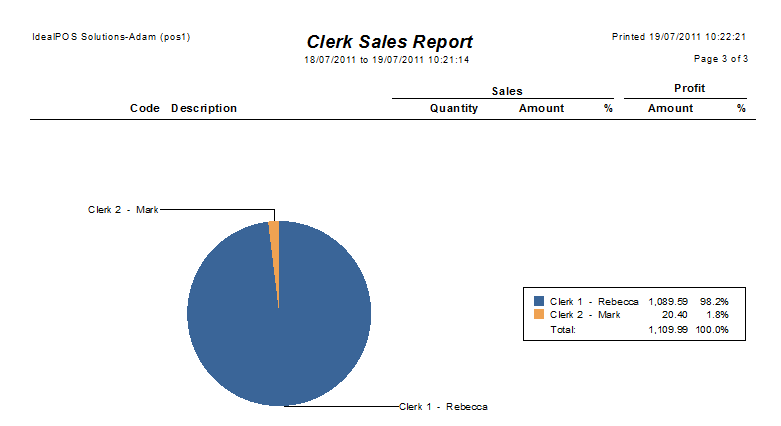
An example of a Report of Stock Item or Department Sales sold by each Clerk.
Return to top
Weekly Sales
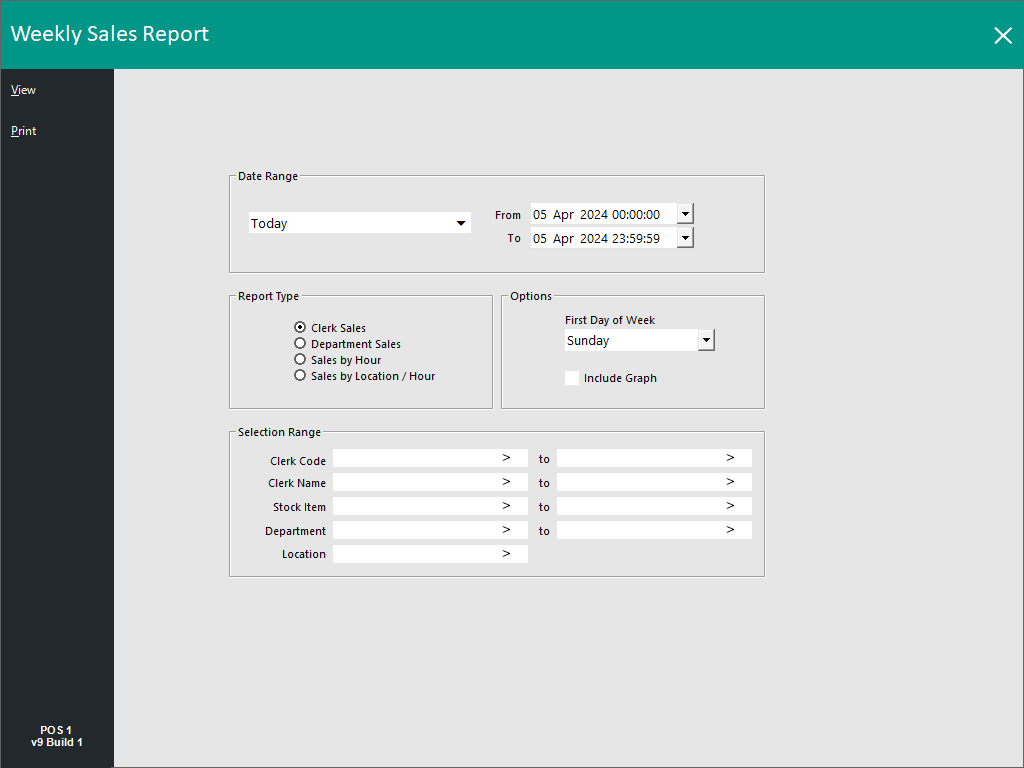
This report will give you the following options:
- Date Range
- Report Type – Clerk Sales, Department Sales, Sales by Hour, Sales by Location/Hour
- Options – First Day of Week, Include Graph
- Selection Range – Clerk Code, Clerk Name, Stock Item, Department, Location
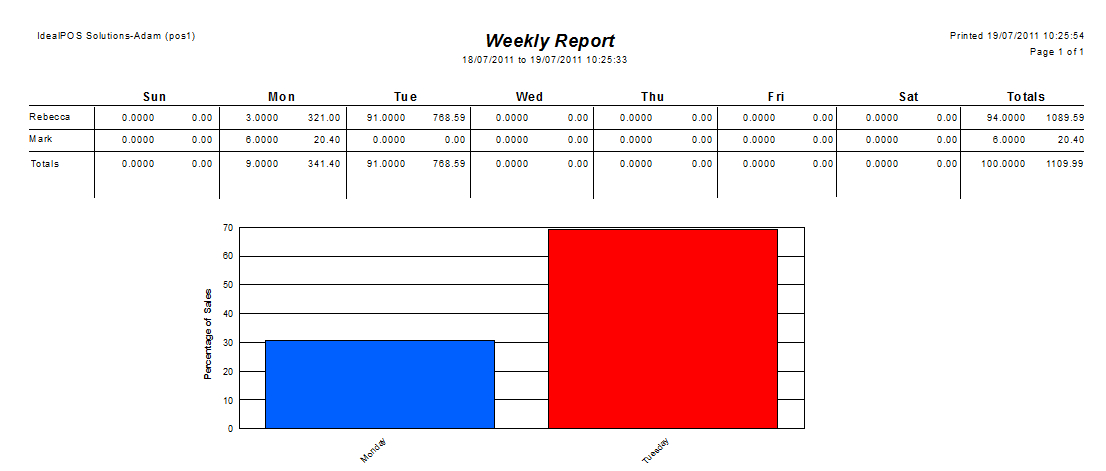
This report will display the selected sales total amounts breakdown by weekday.
Return to top
Weekly Sales Trend
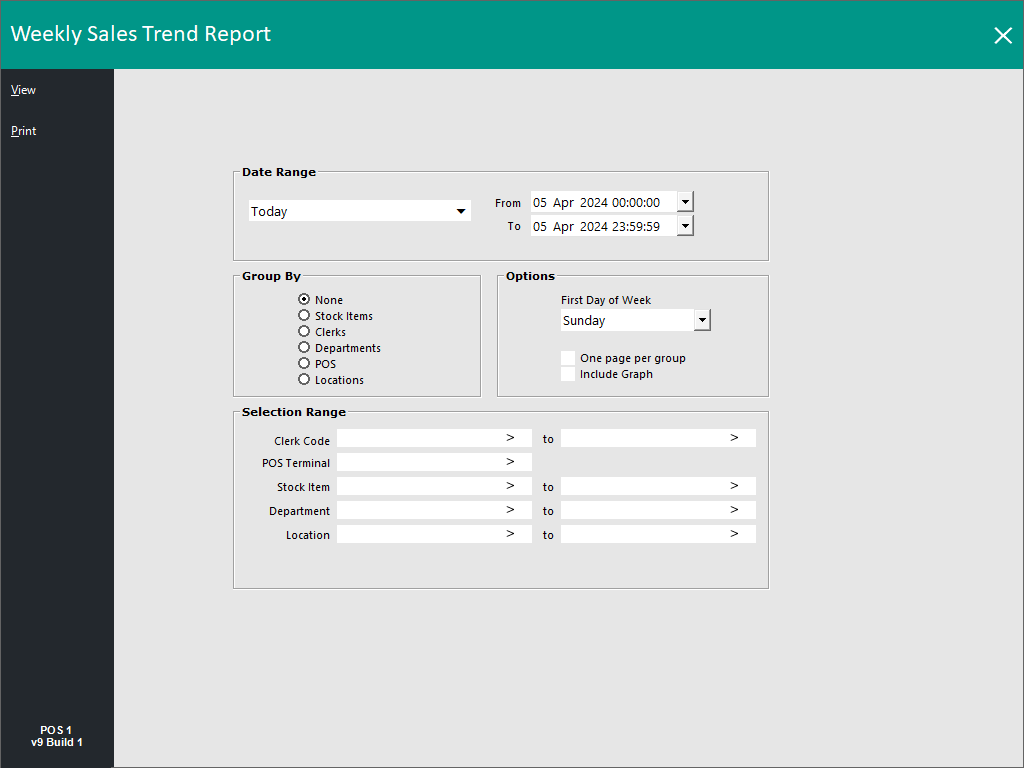
This report will give you the following options:
- Date Range
- Group By – None, Stock Items, Clerks, Departments, POS, Locations
- Options – First Day of Week, One Page per Group, Include Graph
- Selection Range – Clerk Code, POS Terminal, Stock Item, Department, Location
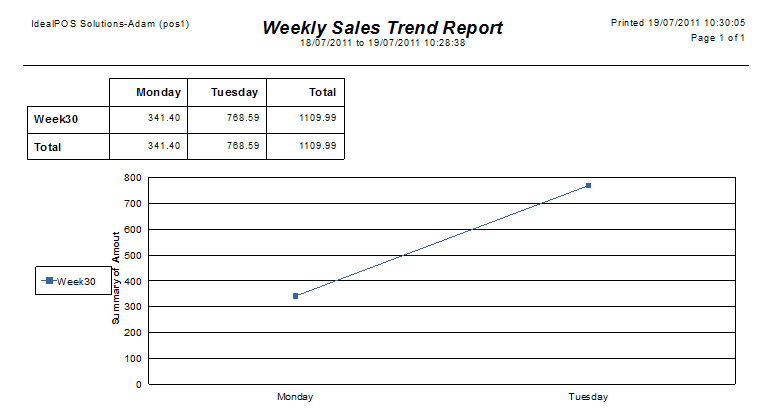
This report will display the totals as a trend over the weekday.
Return to top
Journal History
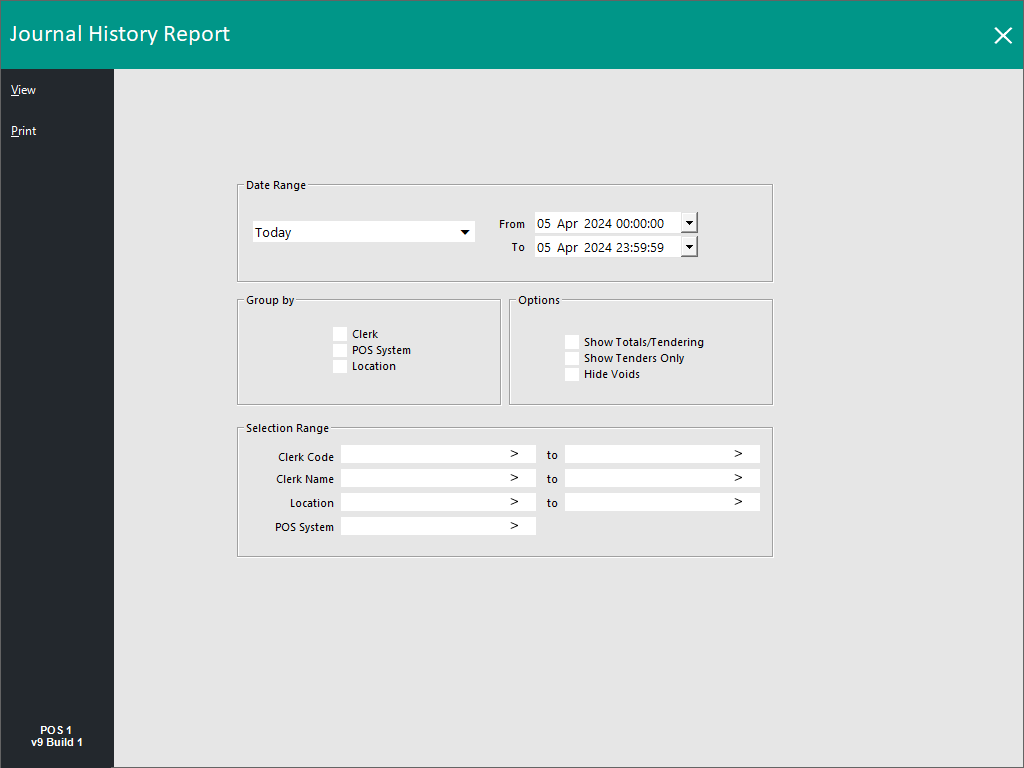
This report will give you the following options:
- Date Range - Select the date(s) that you want to run the report for
- Group by – Clerk, POS System, Location
- Options –
- Show Totals/Tendering - This option will include the type of tender and amount tendered below each Journal shown in the Journal History Report.
- Show Tenders Only - This option will hide all details from each journal and will simply only show the tender type and amount tendered for each Journal.
- Hide Voids - This option will hide any items which were voided within a sale, as well as hiding any Void Entire Sales.
- Selection Range – Clerk Code, Clerk Name, Location, POS System
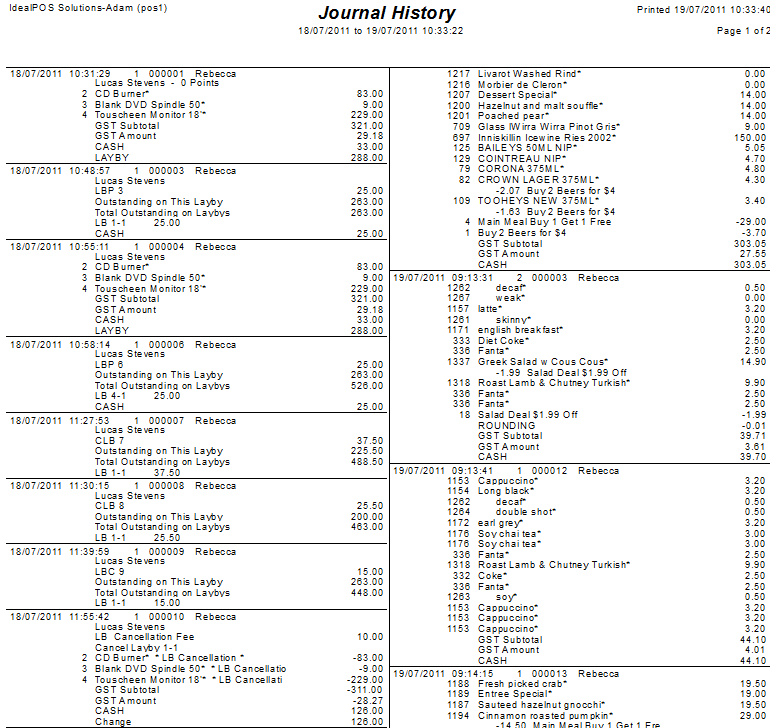
This report will show all transactions performed.
Return to top
Cash Declaration
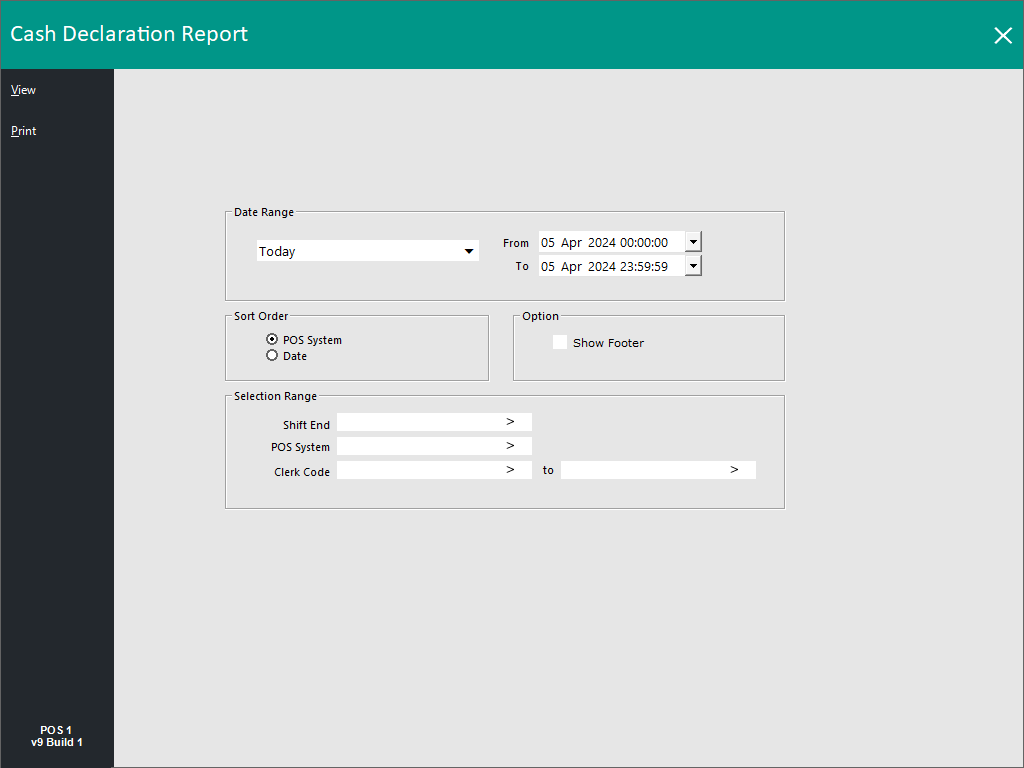
This report will give you the following options:
- Date Range
- Sort Order – POS System, Date
- Option – Show Footer
- Selection Range – Shift End, POS System, Clerk Code
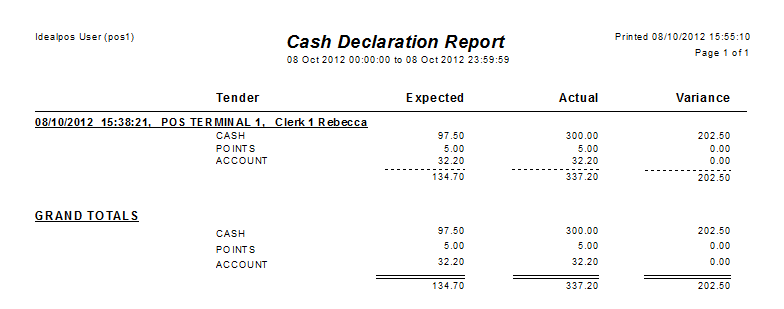
This report will show the details of the Expected, Actual and Variance totals of the End of Shift function.
Return to top
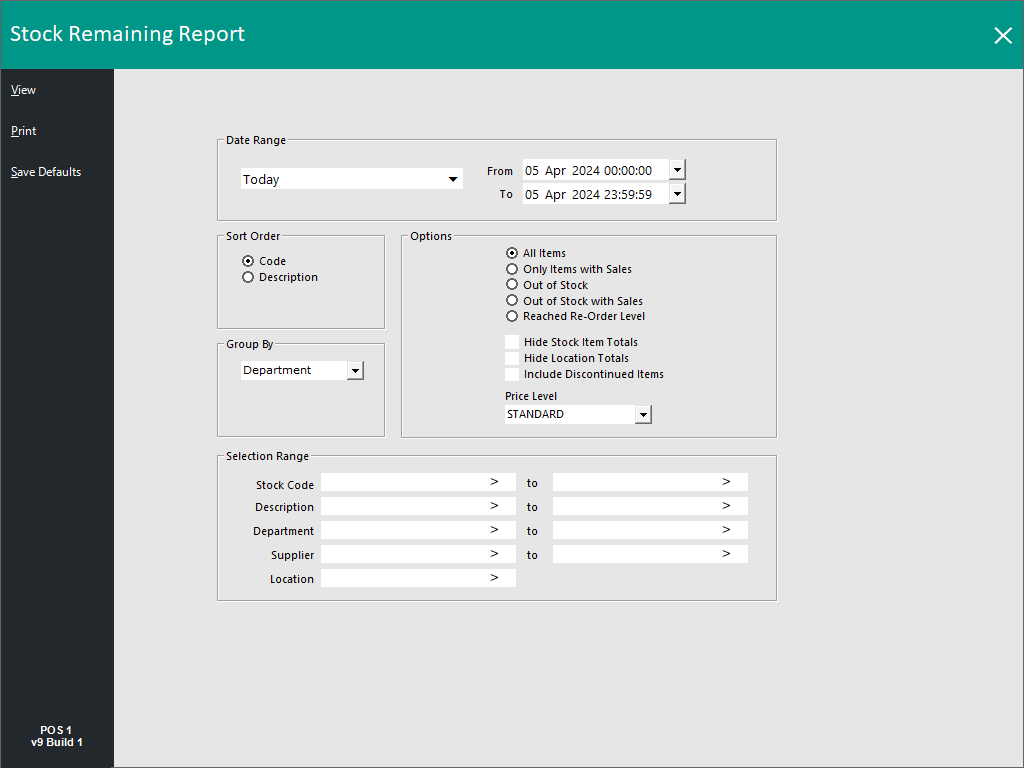
Stock Remaining
The report will give you the following options:
- Date Range
- Sort Order – Code, Description
- Group By –Department, Supplier
- Options – All Items, Only Items with Sales, Out of Stock, Out of Stock with Sales, Reached Re-Order Level, Hide Stock Item Totals, Hide Location Totals, Include Discontinued Items, Price Level
- Selection Range – Stock Code, Description, Department, Supplier, Location
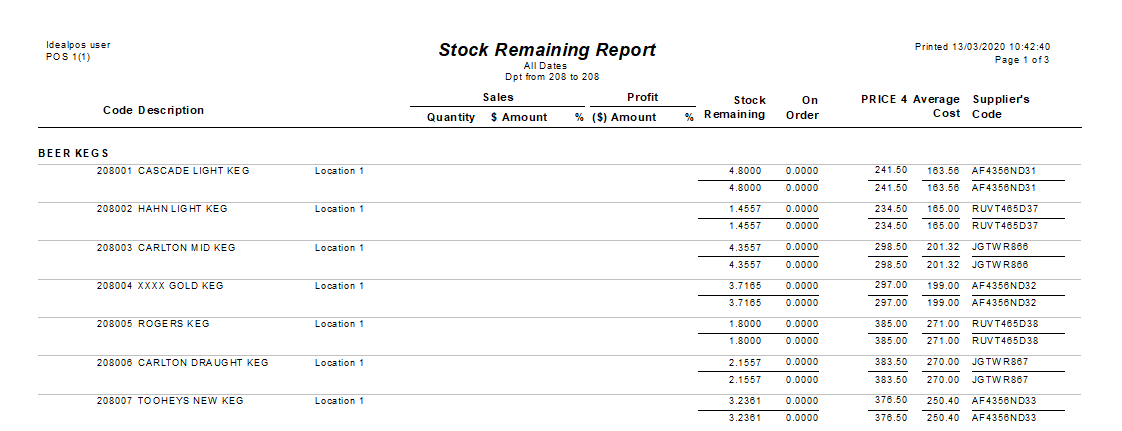
This report will show the stock remaining from the current stock level after sales.
Return to top
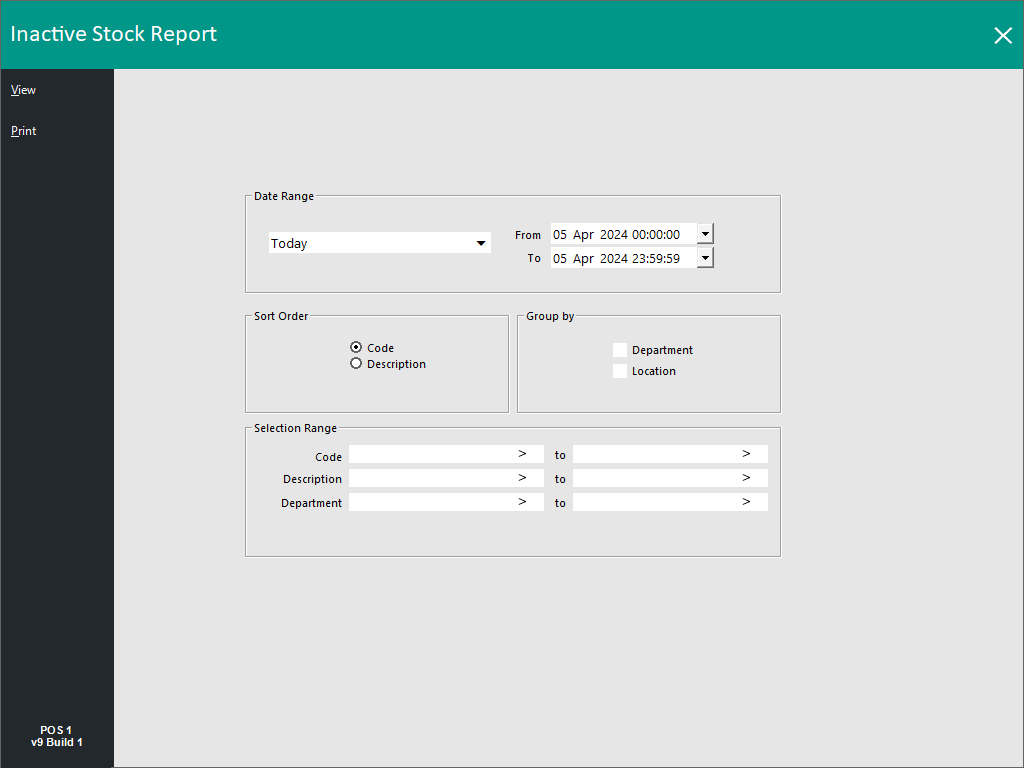
Inactive Stock
This report will give you the following options:
- Date Range
- Sort Order – Code, Description
- Group By – Department, Location
- Selection Range – Code, Description, Department
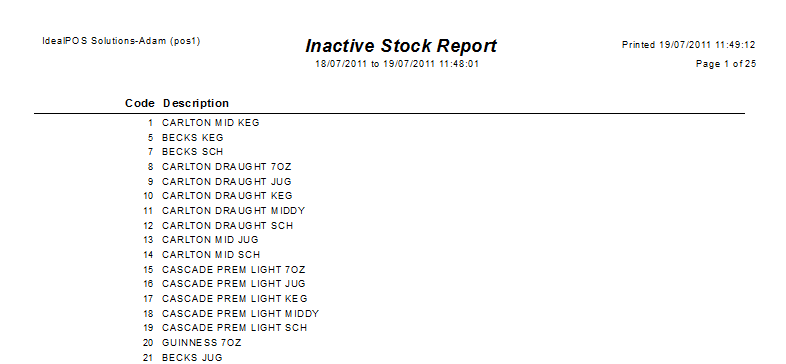
This report will display all items that have not been sold within the selected date range.
Return to top
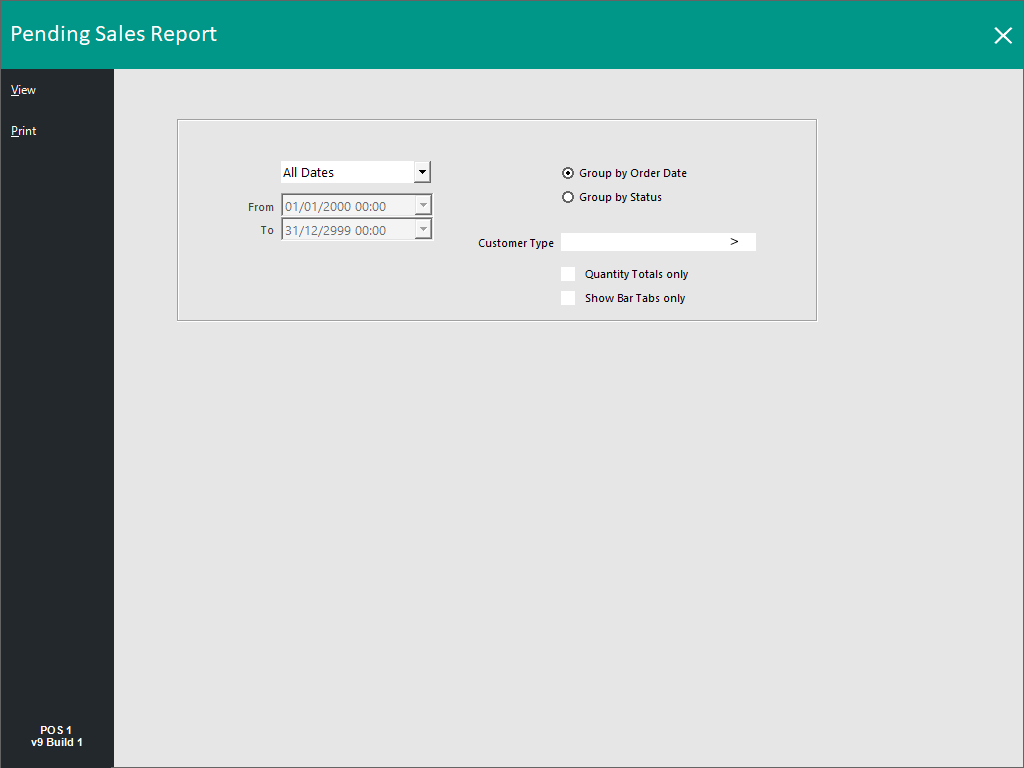
Pending Sales
This report will give you the following options:
- Period/Date Selection: Options available include Today, Tomorrow, This Week, Next Week, etc.
- From/To: These fields display the date range selected for reporting on. When a pre-selected period is selected from the Period/Date selection dropdown box shown above these fields, the values in the From/To fields will be pre-filled automatically. To manually select a date in the From/To fields, ensure that you select the "Custom" option from the Period/Date selection dropdown box shown above these fields.
- Group by Order Date: This option will group the Pending Sales shown in the Report by the Order Date (or the 'Pickup Date' when used with the Pre-Ordering functionality).
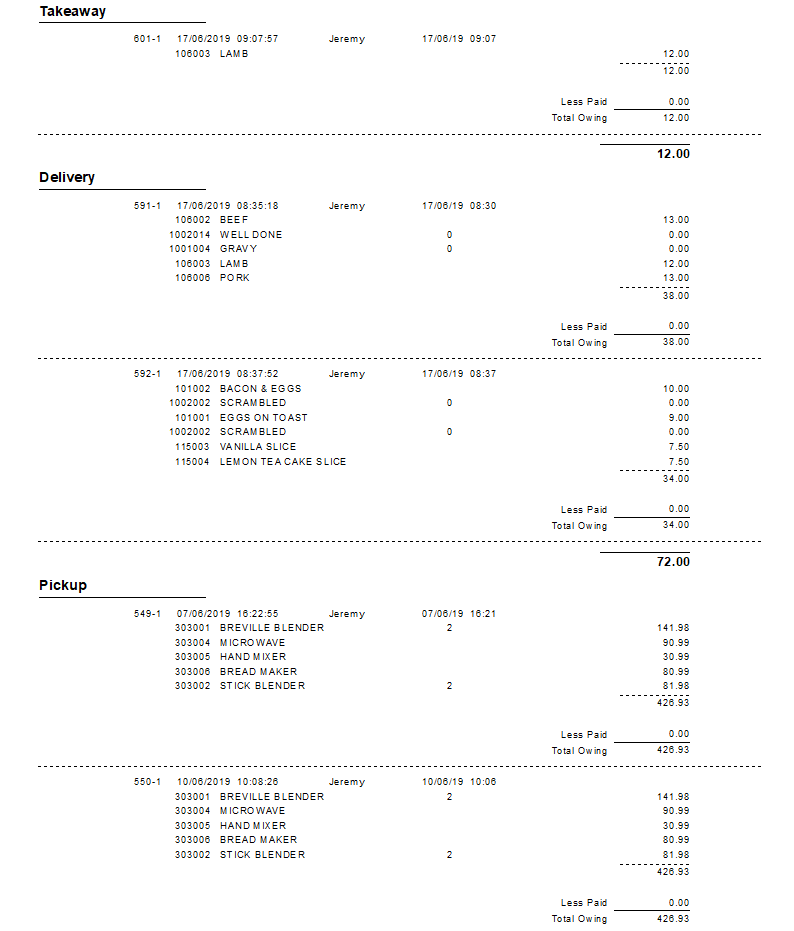
- Group by Status: Enabling this option will group the orders in the Pending Sales Report based on status (e.g. Takeaway, Delivery, Pickup, Cater, etc.). The Sale Type Status is selected at the time the Pending Sale is saved and the Sale Type Statuses can be configured via Setup > Global Options > Sales > Sale Type Status.
- Customer Type: This field enables the selection of the required Customer Types to include in the report. It is possible to select one or more Customer Types. To select multiple Customer Types, press the “>” button, select the Customer Type, press “OK”, then repeat the process until the required Customer Types have been selected. Alternatively, you can manually enter the Customer Type codes separated by commas.
- Quantity Totals only: When the report is run with this option enabled, the report will simply show a list of Stock Items and the quantities ordered and will be grouped by either the Order Date or Status (depending on the Group by selection made when running the report). This enables you to quickly gather a list of Items and their quantities that are required for the selected date range without displaying further details such as Customer Names, Amounts Owing, Clerk Names, etc.
- Show Bar Tabs only: When this option is enabled, the Pending Sales report will only show Bar Tabs and will exclude any non-Bar Tab Customers from appearing in the report. This option is useful when you only need to report on Bar Tabs and don't want to see other Pending Sales, useful for getting a quick listing of all Bar Tabs that are still outstanding.
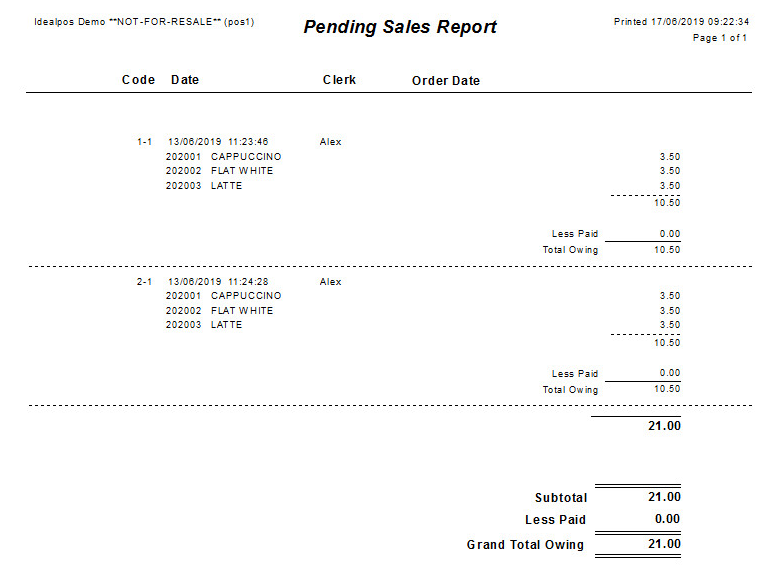
This report provides a complete list of all pending sales as well as the items within each sale.
When you use the Status selections when saving a Pending Sale, these will all be grouped on the report by default, regardless of the order they were saved.
Return to top
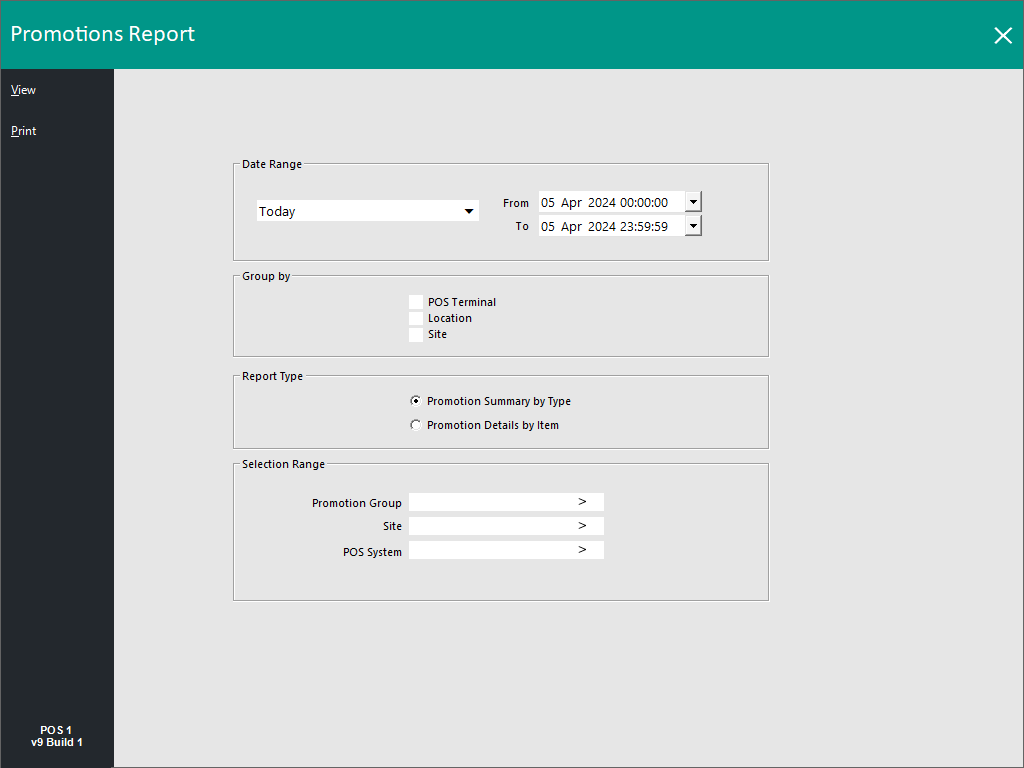
Promotions
This report will give you the following options:
- Date Range
- Group By – POS Terminal, Location, Site
- Report Type – Promotion Summary by Type, Promotion Details by Item
- Selection Range – Promotion Group, Site and POS System. An extra option of Supplier is also displayed when using a Report Type of Promotion Details by Item which allows the report to filter the results based on the selected Supplier.
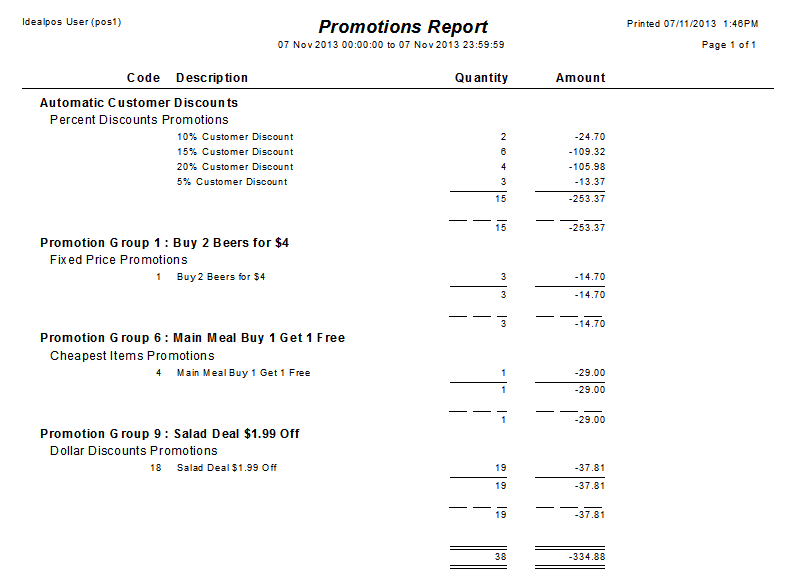
- This report will also show any Automatic Customer Discounts grouped by percentage.
This report shows the promotions activated and the totals within each.
The below example shows the Report Type "Promotion Summary by Type"
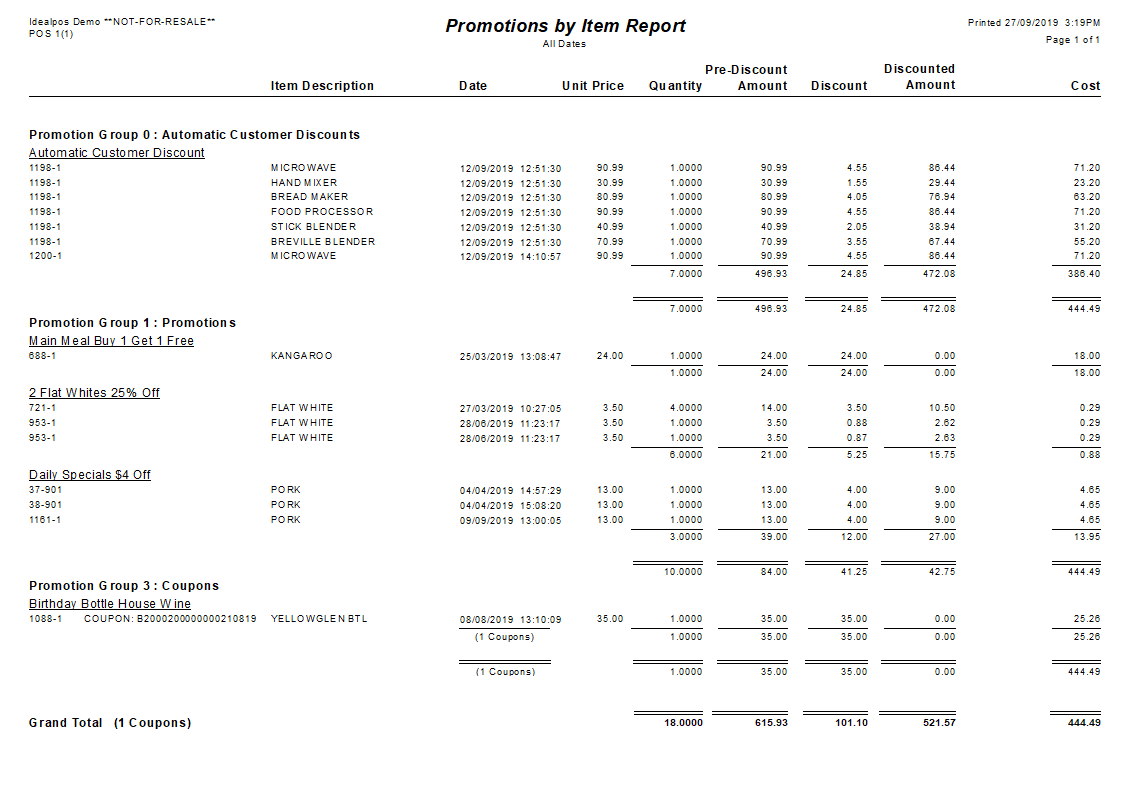
The below example shows the Report Type "Promotion Details by Item"
This Report Type will show the individual Stock Items that are included in a Promotion, along with the Cost of each Stock Item.
The Costs displayed in this report are the costs of the Stock Items at the time that the Promotion was triggered.
Should you need to review the changes to a Stock Item's Cost, use the Price Changes Report available via Reports > Stock Control > Price Changes > Enable checkbox "Cost Price Changes"
Return to top
Price Level Comparison
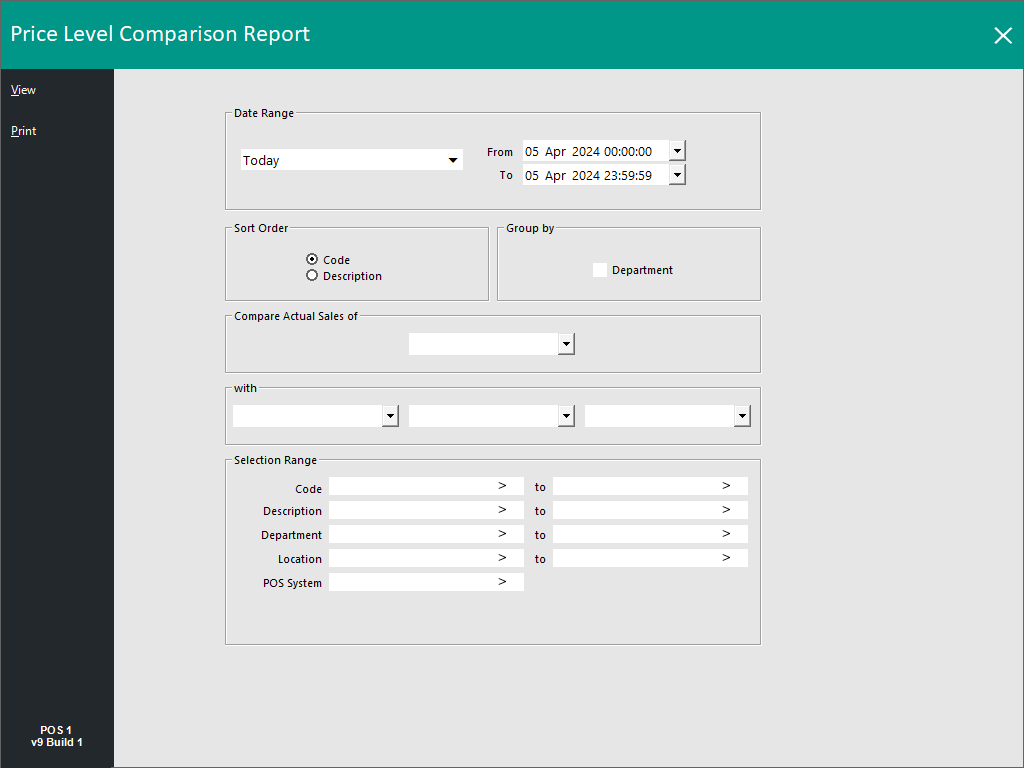
This report will give you the following options:
- Date Range
- Sort Order – Code, Description
- Group By – Department
- Compare Actual Sales of – All Existing Price Levels, Each Individual Price Level
- With – 3 separate fields to select an Individual Price Level
- Selection Range – Code, Description, Department, Location, POS System
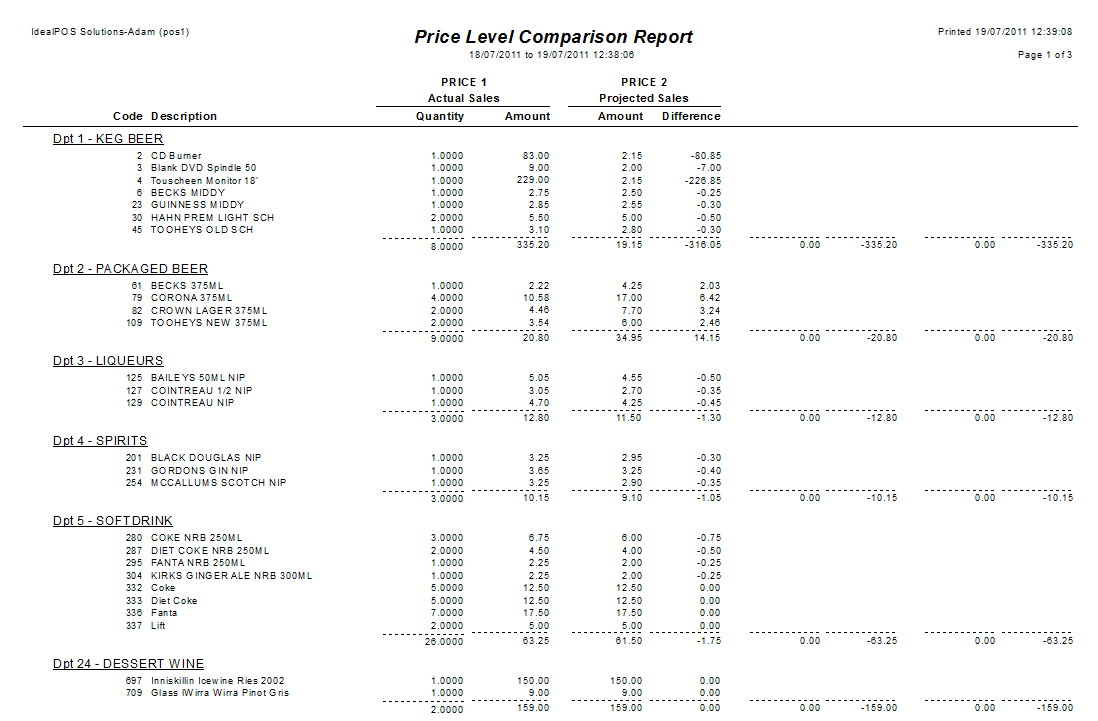
This report allows you to compare the actual price level of items sales with other price levels.
Return to top
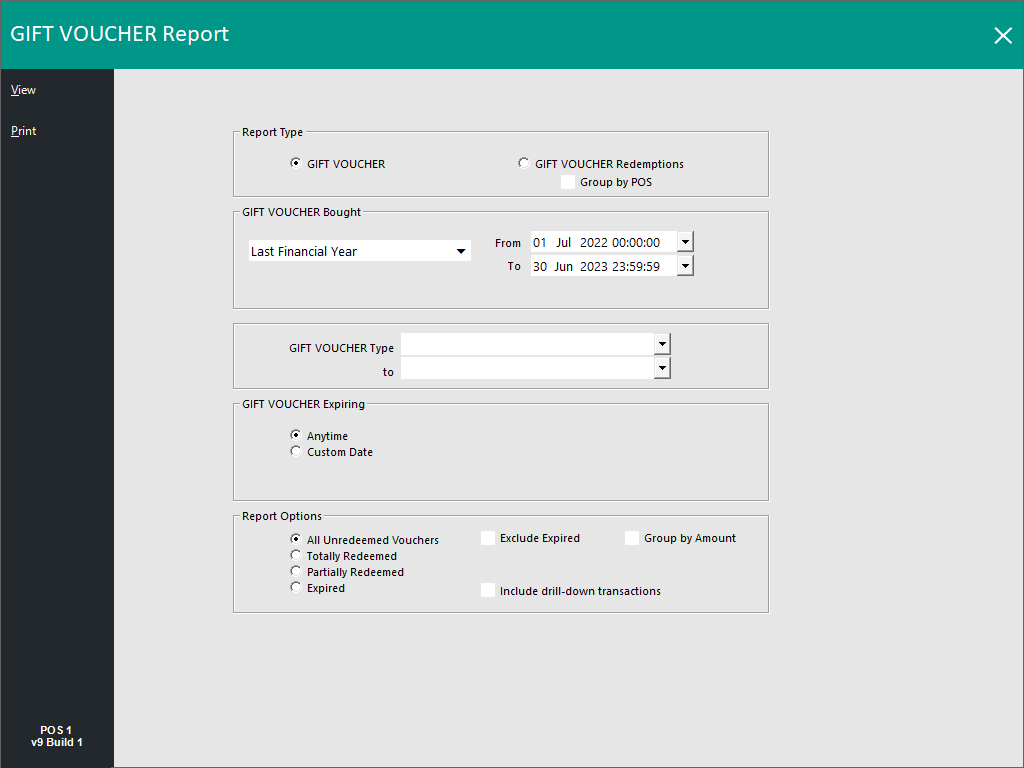
Gift Vouchers/Gift Voucher Redemption
This report will give you the following options:
- Report Type – Gift Vouchers, Gift Voucher Redemptions (by POS)
- Vouchers Bought – Date Range
- Gift Voucher Type Range
- Vouchers Expiring Range
- Report Options – All Unredeemed, Totally or Partially Redeemed, Expired, All Vouchers, Exclude Expired, Group by Amount, Include Drill-Down Transactions. When using Include Drill-Down Transactions, you have the ability to double-click on a Gift Voucher code within the report to Drill-Down into the voucher. Drilling Down into the Voucher Code displays further details such as the initial sale of the voucher as well as any redemptions which occurred for the voucher and the values of all redemptions for the voucher (if the voucher was redeemed in multiple transactions).
This report will show the Gift Voucher details dependent of the options selected.
Return to top
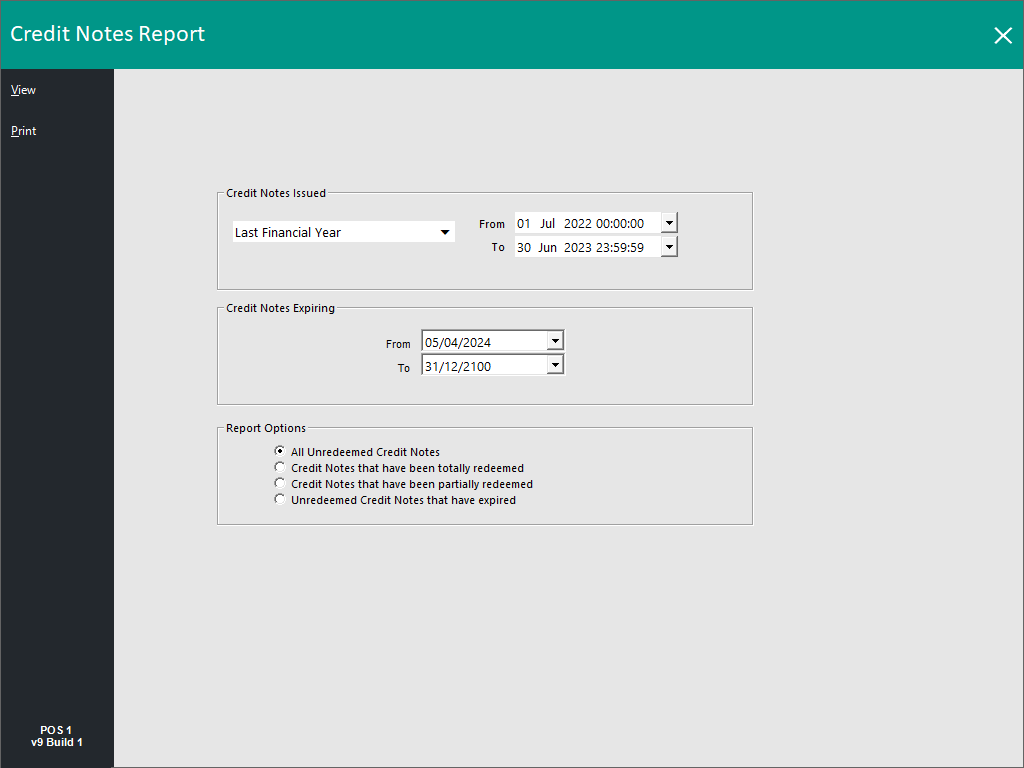
Credit Notes
This report will give you the following options:
- Credit Notes Issued – Date Range
- Credit Notes Expiring – Date Range
- Report Options – All Unredeemed, Totally Redeemed, Partially Redeemed, Expired Unredeemed
This report will show the Credit Note details dependent on the options selected.
Return to top
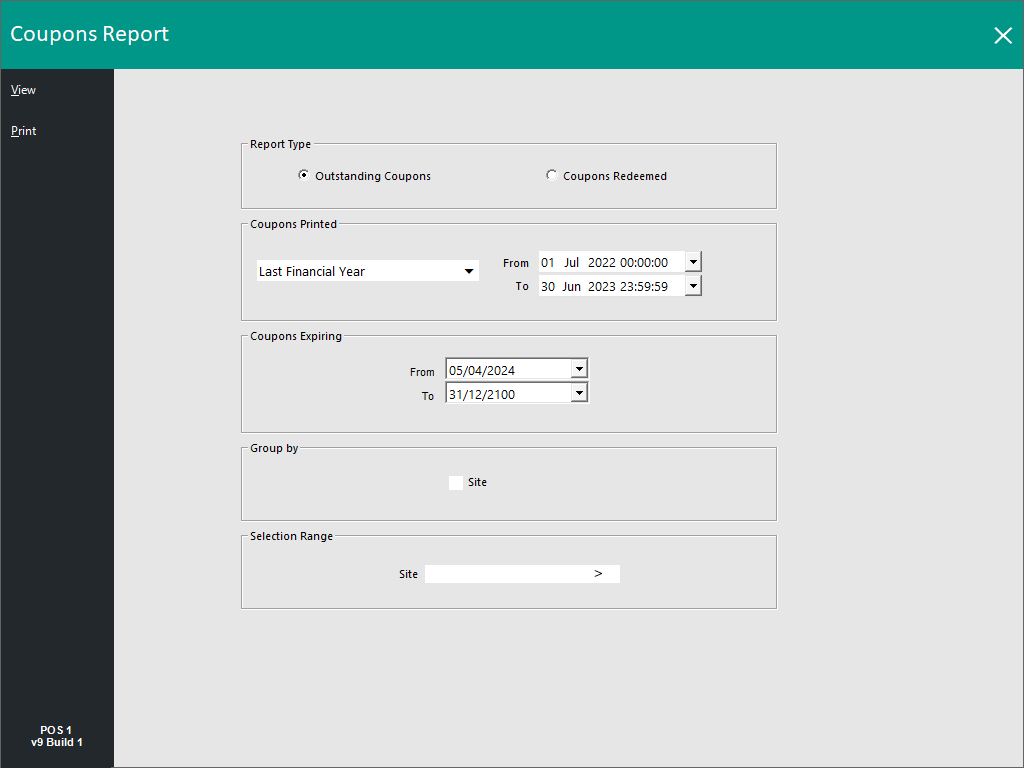
Coupons
This report will give you the following options:
- Report Type – Outstanding Coupons, Coupons Redeemed
- Coupons Printed – Date Range
- Coupons Expiring – Date Range
- Group By - Toggle Grouping by Site on or off. When unchecked, Coupons will be displayed in a single list. When checked, Coupons will be grouped by the site which they were printed/redeemed at.
- Selection Range - Select a Site or list of sites which you want to include in the Coupon Report. If the Site field is left as blank, all sites will be included in the Coupons Report.
Note!
The Coupons Report will only display Serialised Coupons.
Any Outstanding Coupons or Redeemed Coupons that were issued as "Print Only" will not be included in this report.
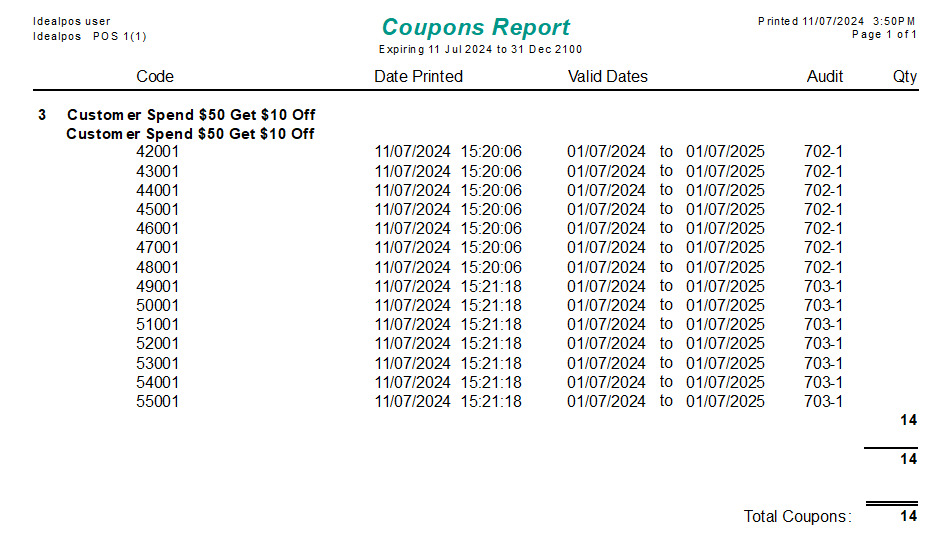
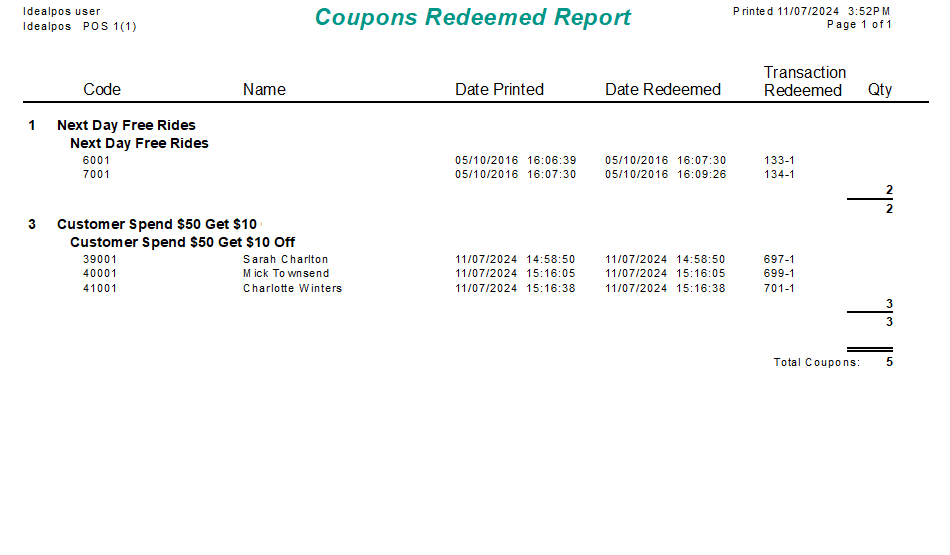
This report will detail the coupons that have been activated.
When selecting "Coupons Redeemed", the Coupons Report will display a list of Serialised Coupons that have been redeemed.
If the Redeemed Serialised Coupons were redeemed by a Customer, the Customer's Name will appear in the Coupons Redeemed Report.
Return to top
Price Changes
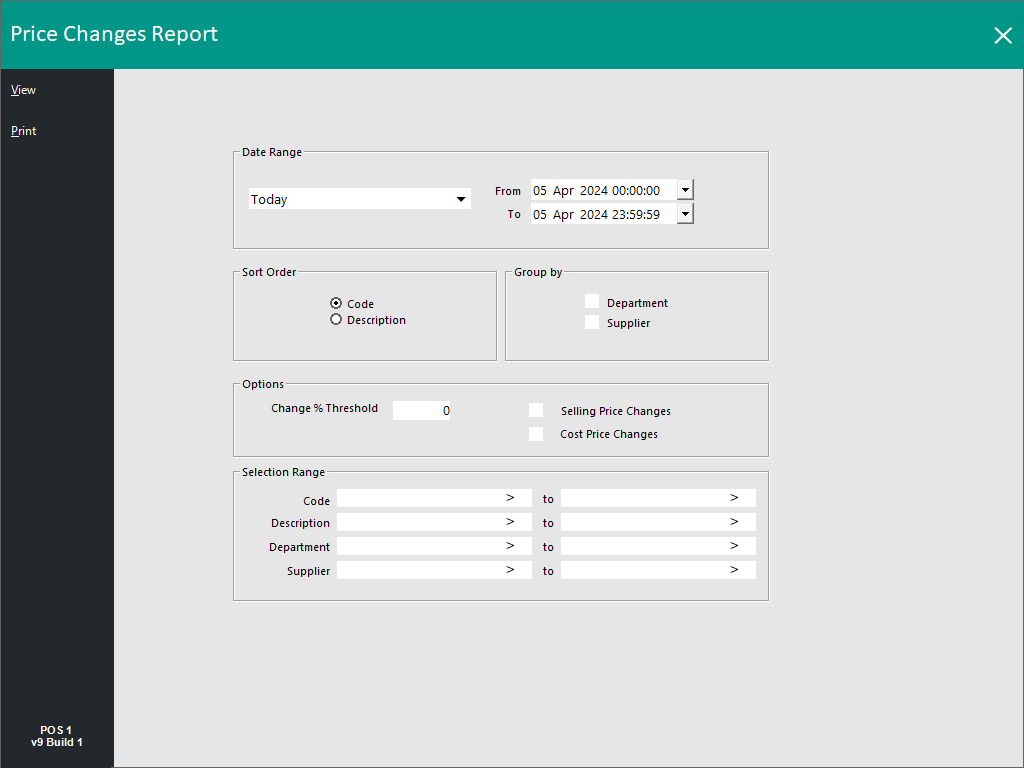
This report will give you the following options:
- Date Range
- Sort Order – Code, Description
- Group By – Department, Supplier
- Options – Change % Threshold, Selling Price Changes, Cost Price Changes
- Selection Range – Code, Description, Department, Supplier
This report will detail the stock items that have had price changes.
Open topic with navigation
